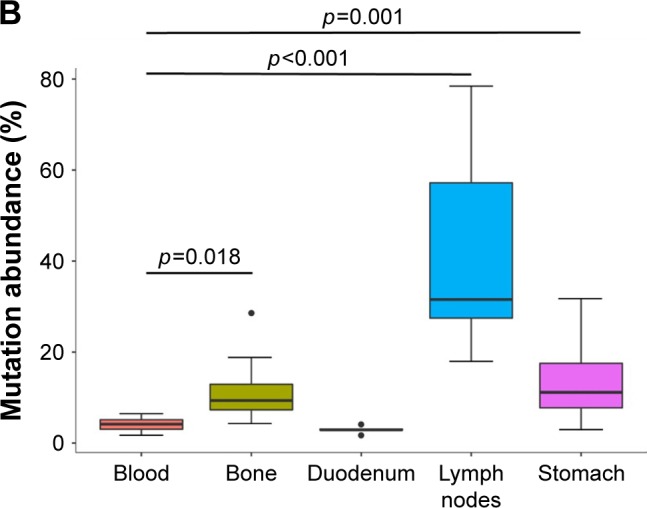
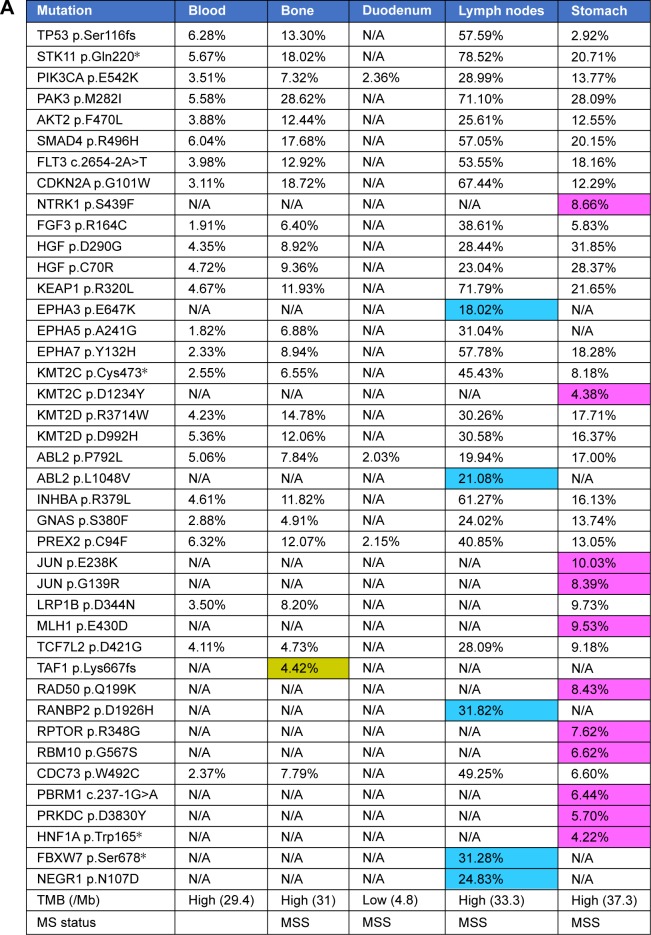
Figure 3.

(A) Mutational analysis on gastric, duodenal, bone, mediastinal lymph node metastases, and blood. Different colors represent unique mutation sites in each location. (B) The mutation abundance on all metastatic foci and blood. The p-value of <0.05 based on the 2-sided test is considered to be statistically significant.
Note: * nonsense mutation.

