
Figure 4.
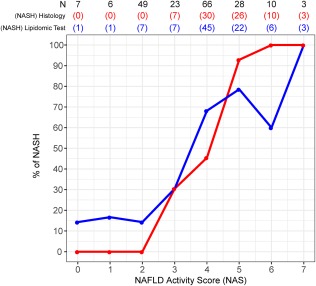
Relationship between the NAS and the diagnosis of NASH using different approaches. For each NAS, the fraction of cases diagnosed as NASH is represented. The total number of observations for each score (N) and the number of patients diagnosed as NASH are shown at the top of the graph. Blue, histologic diagnosis as described in Patients and Methods; red, diagnosis of NASH using the TG biomarkers.