Figure 5.

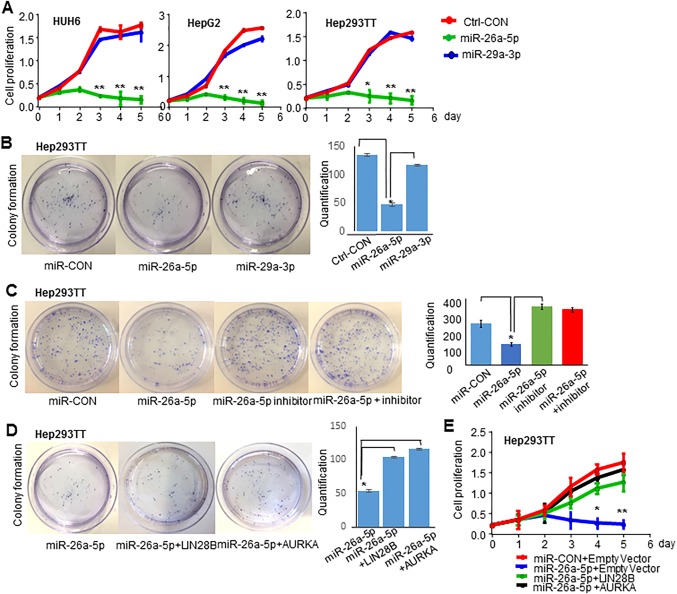
Re‐expression LIN28B and AURKA promotes HB cell growth. (A) Growth curves of control and HUH6 (left), HepG2 (middle), and Hep293TT (right) cells transfected with mimic control, 100 nmol miR‐26a‐5p mimic, and 100 nmol miR‐29a‐3p mimic. (B) Colony formation assay of Hep293TT cells transfected with mimic control, miR‐26a‐5p mimic, and miR‐29a‐3p mimic. (C) Colony formation assay of Hep293TT cells transfected with mimic control, miR‐26a‐5p mimic, miR‐26a‐5p inhibitor, and miR‐26a‐5p mimic with its inhibitor. (D) Colony formation assay of Hep293TT cells transfected with control, miR‐26a‐5p mimic, miR‐26a‐5p mimic plus LIN28B plasmid, and miR‐26a‐5p mimic plus AURKA plasmid. (E) Hep293TT cells were transfected with mimic control plus 2 μg empty vector control, miR‐26a‐5p mimic plus 2 μg empty vector control, miR‐26a‐5p mimic plus 2 μg LIN28B plasmid, and miR‐26a‐5p mimic plus 2 μg AURKA plasmid. The cell proliferation assay was performed from day 0 to day 5. All data are shown as mean ± SEM (triplicate assays). Abbreviation: CON, control.
