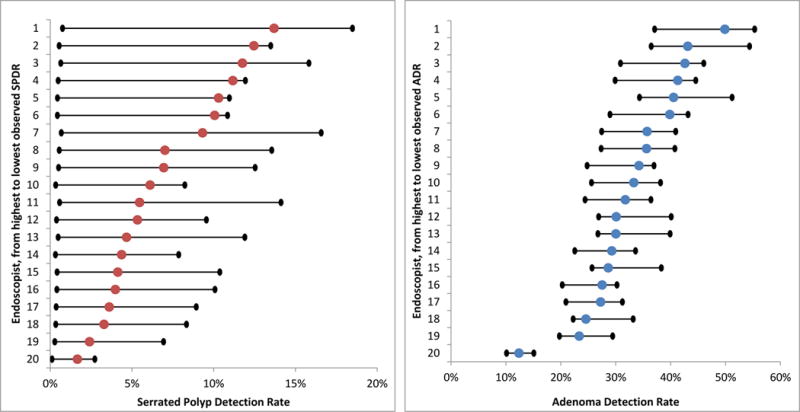
Figure 3.

Translating Pathologist Serrated Polyp and Adenoma Classification Rates to Endoscopist Serrated Polyp and Adenoma Detection Rates for the 20 Highest-Volume Endoscopists
Notes: For each figure, the colored dot represents the endoscopist’s observed serrated polyp detection rate (red, left panel) or adenoma detection rate (blue, right panel). The black dot to the left of each colored dot represents what each endoscopist’s outcome would be if all of their colonoscopy specimens were analyzed by the pathologist with the lowest classification rate for that outcome in the sample (1% for serrated polyp classification, 48% for adenoma classification). The black dot to the right of each colored dot represent what each endoscopist’s outcome would be if all their colonoscopy specimens were analyzed by the pathologist with the highest classification rate for that outcome in the sample (20% for serrated polyp classification, 71% for adenoma classification). For additional details on how these values were calculated, please see Appendix 5.
