
Figure 3. Platelet Count Distribution.
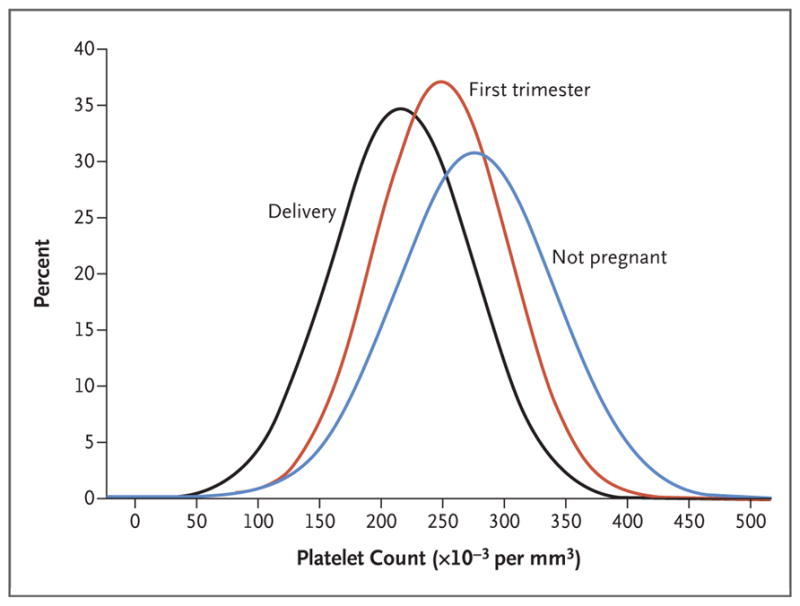
Shown are the distribution of the mean platelet counts of the nonpregnant women and the distribution of the mean platelet counts during the first trimester (mean gestation, 8.7 weeks) and at the time of delivery in the women who had uncomplicated pregnancies. The distributions of the mean platelet counts for all three curves were symmetric, with a slight skew toward higher platelet counts that was consistent across all three curves. The mean and median platelet count values for each of the three distribution curves differed by less than 3%. These analyses are presented in Table S2 in the Supplementary Appendix. Platelet counts measured during the postpartum period were not included in this figure because of the small sample size.