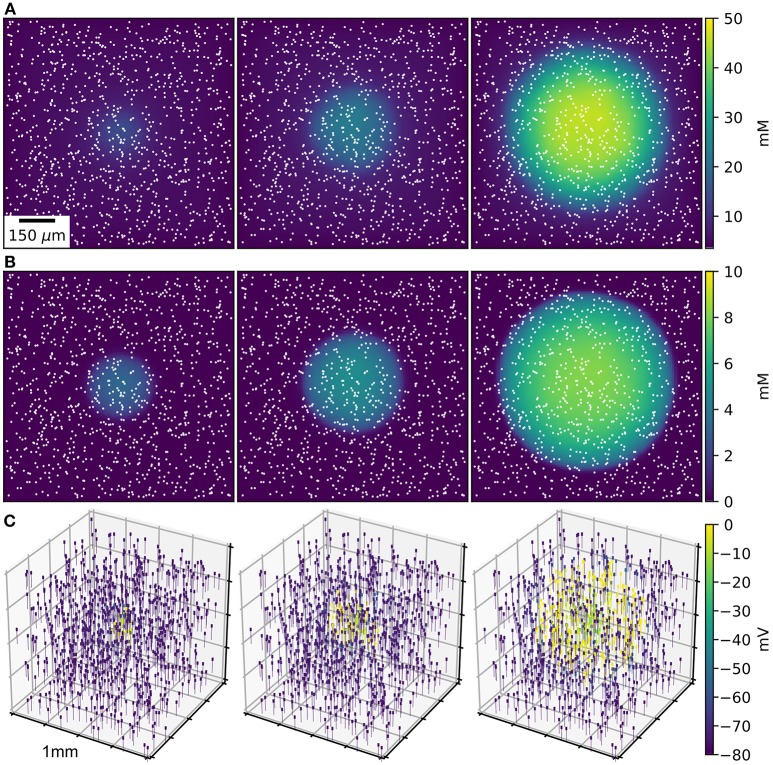
Figure 1.
SD wave Time points at 10, 20, 30 s, with concentrations averaged over the depth of 1 mm3 of ECS. (A) Extracellular K+ with glial uptake and Dirichlet boundary conditions. (B) Glial uptake occupancy. (C) Membrane potential for 1,000 of the 90,000 cells [their locations are shown in (A,B) by white points]. Video available in Supplementary Data.

