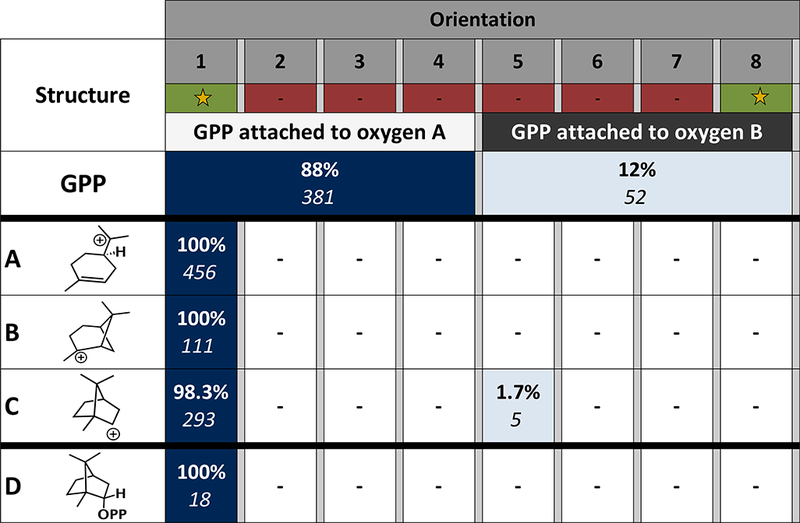
Figure 3.

Heat map of the docking results. For GPP, only two discreet orientations were tested: attachment to oxygen A or B. Ion-pair orientations for other structures are depicted in Figure 2. The orientations highlighted with a star are consistent with the labeling experiment conducted by Croteau et al.35 The darker the color filling each cell of the table, the more low energy solutions were found for that orientation. The percentage of low energy structures identified for each docked structure are shown in bold, the number of low energy structures remaining after filtering is shown in italics. The thick black lines separate structures docked with different constraints.
