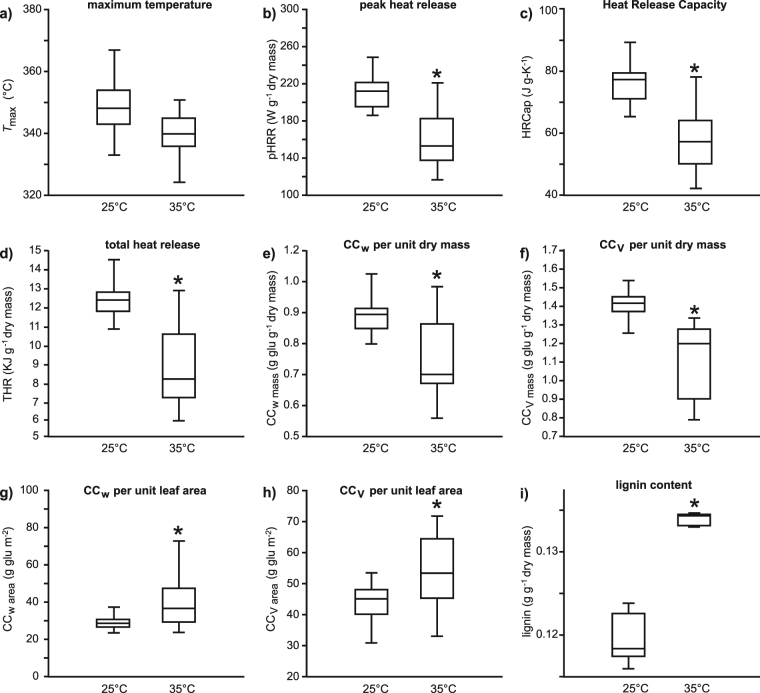
Figure 2.
Box plots representing the effects of growth at 25 and 35 °C on the parameters determined by calorimetry and construction costs of Ginkgo biloba leaves: (a) maximum heat release (one-way ANOVA F1,53 = 3.801; P = 0.057); (b) peak heat release (pHRR)(one-way ANOVA F1,53 = 58.9; P = 9.0 × 10⁻¹⁰); (c) heat release capacity (HRCap)(one-way ANOVA F1,53 = 61.9; P = 4.6 × 10⁻¹⁰); (d) total heat release (THR)(one-way ANOVA F1,53 = 90.7; P = 4.5 × 10⁻¹³); (e) leaf construction cost per unit dry mass following Williams, et al.51 (CCw mass) (one-way ANOVA F1,53 = 34.2; P = 3.1 × 10⁻⁷); (f) leaf construction cost per unit dry mass following de Vries, et al.53 (CCv mass) (one-way ANOVA F1,53 = 65.2; P = 8.4 × 10⁻¹¹); (g) CCw per unit leaf area (CCw area) (one-way ANOVA F1,53 = 14.5; P = 3.6 × 10⁻⁴); (h) CCv per unit leaf area (CCv area) (one-way ANOVA F1,53 = 10.6; P = 0.00195), and; (i) lignin content per unit dry mass (one-way ANOVA F1,53 = 114.9; P = 8.4 × 10⁻⁷). Box plots presented as in Fig. 1.

