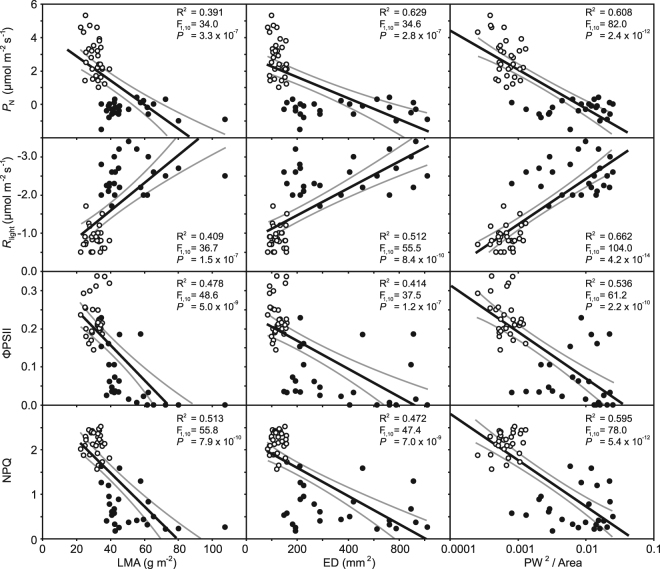
Figure 7.
Correlations between photosynthesis, R light, ΦPSII and NPQ and morphological characteristics of leaves of Ginkgo biloba grown at 25 °C (white fill symbols) and 35 °C (black fill symbols). The ratio of PW2 to area is plotted on a logarithmic scale. R2, F and P values indicate the results of linear regression. The central black line indicates the line of best fit. The grey lines either side of the best-fit line indicate 95% confidence intervals of the mean.

