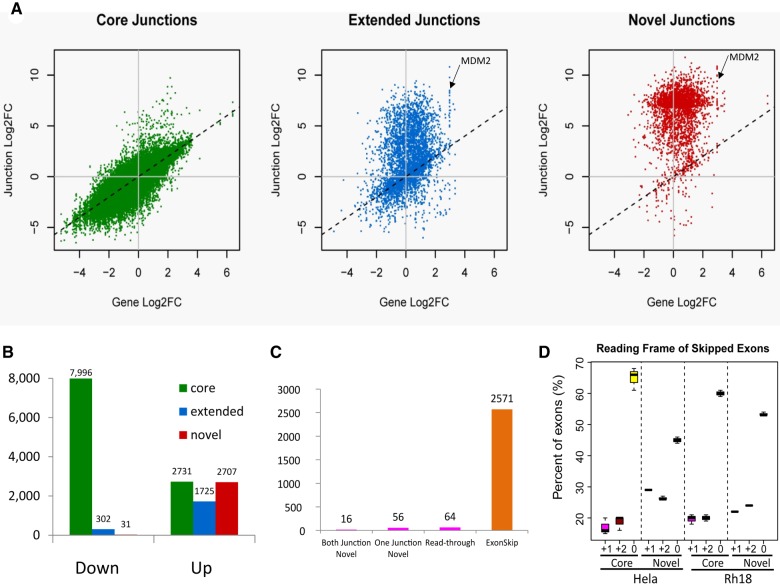
FIGURE 4.
Analysis of differentially expressed exon junctions in sudemycin D1-treated Rh18 cells (A) Changes in the level of exon junctions compared with the change in gene expression induced by sudemycin D1. Core—defined isoforms identified within the Refseq (NCBI) database; Extended—isoforms defined by the ENSEMBL, AceView, and UCSC databases; Novel—all novel splice junctions that are not detected in untreated samples and are absent from the reference databases. (B) The types of exon junctions observed in differentially expressed exon:intron sequences. Only those with at least a fourfold change and a FDR < 0.05 were included. (C) The distribution of novel junctions observed following sudemycin D1 treatment. Both Junctions Novel—both the 5′ and the 3′ splice junctions are not present in the four databases mentioned above; One Junction Novel—either the 5′ or the 3′ exon is novel; Read-through—the two exon junctions are from two different genes in the neighborhood; Exon skipping—the entire exon is missing from the RNA transcript, with the two exon junctions matching the known acceptor and donor sites in annotated isoforms of the same gene. (D) The relative percentage of “core” or “novel” exon junctions leading to three different reading frames (in-frame, frame+1, frame+2) in HeLa and Rh18 cells upon SF3B1 inhibition.

