FIGURE 5.

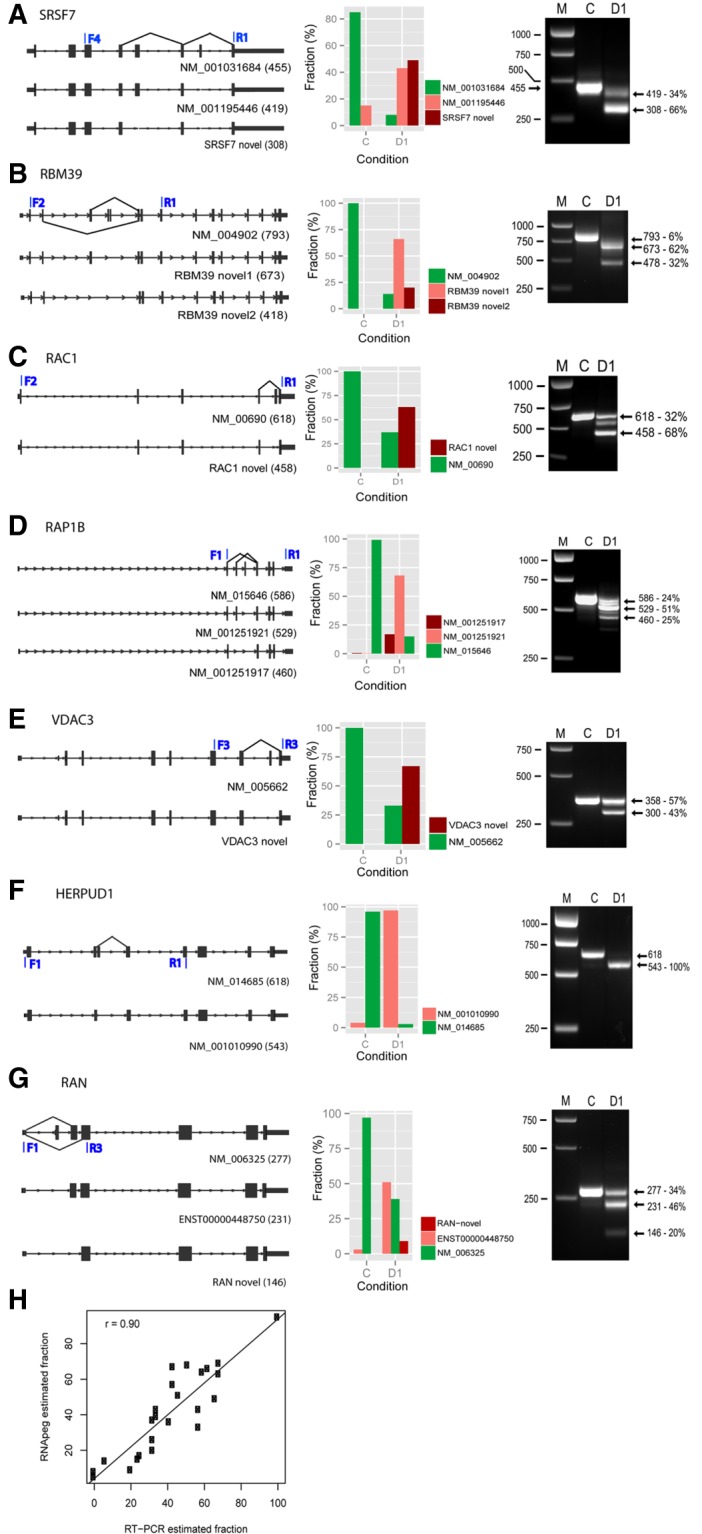
Validation of novel AS exon junctions by RT-PCR. (A–G) (Left panels) RNA structures for canonical (upper line) and AS isoforms (lower lines) for selected genes. The latter were identified in RNA data sets from sudemycin D1-treated Rh18 cells using in house software (RNApeg). (Middle panels) The estimation of the fraction of each splicing event based on supporting exon junction reads. (Right panels) PCR analysis for expressed transcripts of these genes following treatment with either sudemycin D1 (D1) or DMSO (C). Molecular weight markers (M) and band sizes are indicated in bp. (H) Scatter plot showing the correlation of the fraction of AS events with that obtained from agarose gel densitometric analysis of PCR samples using the same RNA. The plots were based on 10 selected genes (MDM2, HERPUD1, HNRNPR, RAC1, RAN, RAP1B, RBM39, SMEK1, SRSF7, and VDAC3).
