FIGURE 2.
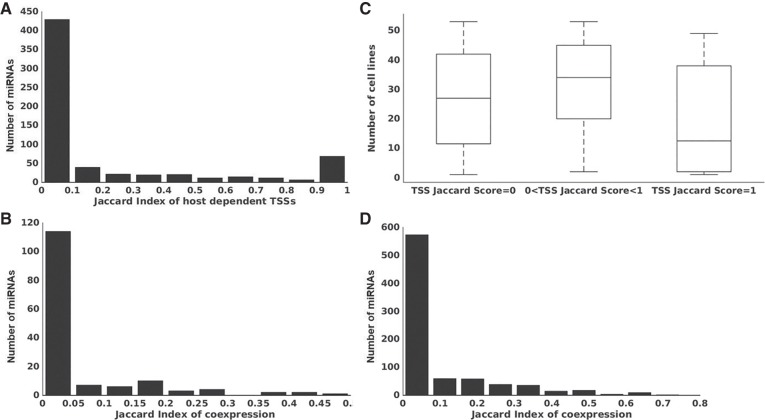
Coexpression and cotranscription of intronic miRNAs with their host genes. (A) Distribution of Jaccard index of host dependent TSSs for 638 intronic miRNAs over 54 cell lines, indicating little cotranscription of miRNA and host. (B) Distribution of the Jaccard index in A is independent of the number of cell lines in which data were available. Intronic miRNAs with TSS data were divided into three groups according to their Jaccard index for TSSs as follows: Jaccard index of 0 (left); Jaccard index above 0 and below 1 (center); Jaccard index of 1 (right). Box plots were made for each group showing the distribution of the number of cell lines in which each intronic miRNA had TSS data. It is clear that the low/high Jaccard indices are not due to small/large number of cell lines for which data were available. (C) Distribution of Jaccard index of coexpression of 149 intronic pre-miRNAs with their hosts over 28 cell lines based on pre-miRNA expression data from Landgraf et al. (2007), indicating little coexpression of miRNA and host. (D) Similarly, distribution of Jaccard index of coexpression of 829 intronic pre-miRNAs with their hosts over 14 cell lines based on miRNA expression data from miRmine (Panwar et al. 2017), also indicating little coexpression.

