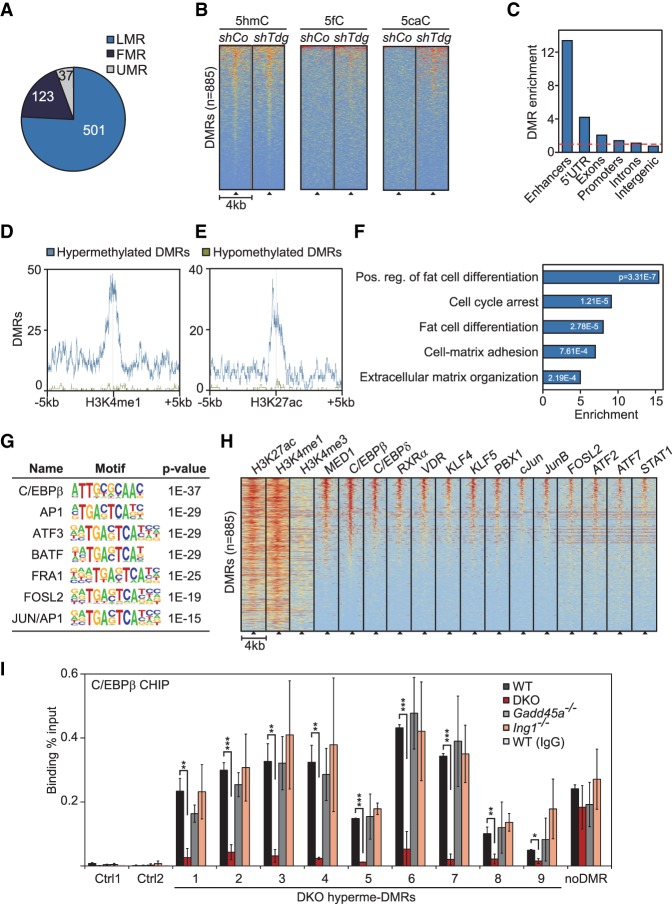
Figure 2.
Gadd45a/Ing1 double-knockout MEFs show hypermethylation of C/EBP-dependent adipogenic superenhancers. (A) Overlap of hypermethylated DMRs in Gadd45a/Ing1 double-knockout MEFs with regions in wild-type MEFs that are lowly methylated, fully methylated (FMR), or unmethylated (UMRs). Definitions of FMRs, LMRs, and UMRs are according to Stadler et al. (2011). DMRs in partially methylated regions are not displayed. (B) Heat maps of depicted oxidative DNA modifications centered on the double-knockout hypermethylated DMRs (black triangles). DNA modifications are from DIP-seq (DNA immunoprecipitation combined with sequencing) in embryonic stem cells that were treated with unspecific (shCo) or Tdg-specific shRNA (Shen et al. 2013). Data were sorted based on cumulative normalized signal intensity of individual DNA modifications around DMRs. The red–yellow–blue key indicates high to low DIP-seq signal. (C) Enrichment of hypermethylated DMRs (identified in double-knockout MEFs) of the depicted genomic elements. Enhancers are defined by combined H4K3 monomethylation (H4K3me1) and H3K27 aetylation (H3K27ac) occupancy in MEFs. Promoters are defined as ±2 kb surrounding the transcription start sites (TSSs). The red line indicates no enrichment. (D,E) Localization of hypermethylated and hypomethylated DMRs around enhancer marks H3K4me1 (D) and H3K27ac (E) in MEFs. (F) Gene ontology (GO) enrichments of genes in proximity to enhancer-associated hypermethylated DMRs with corresponding P-values. The full list of GO enrichments is shown in Supplemental Table S1. (G) Transcription factor (TF)-binding motif analysis of hypermethylated DMRs and associated P-values relative to genomic background. (H) Heat maps of the depicted histone marks and TFs centered on the double-knockout hypermethylated DMRs (black triangles). Histone marks are from ChIP-seq (chromatin immunoprecipitation [ChIP] combined with high-throughput sequencing) in MEFs (Yue et al. 2014). TF ChIP-seq data are from 3T3-L1 cells differentiated for 4 h along the adipogenic lineage (Siersbaek et al. 2011, 2014). Data were sorted based on the cumulative normalized signal intensity of analyzed TFs around DMRs. The red–yellow–blue key indicates high to low ChIP-seq signal. (I) ChIP-qPCR (ChIP combined with quantitative PCR [qPCR]) of endogenous C/EBPβ in wild-type, Gadd45a, or Ing1 single-knockout or double-knockout MEFs. qPCR was conducted on nine hypermethylated DMRs, an unrelated C/EBPβ target region (Siersbaek et al. 2014), and two independent negative control regions (Ctrl1–2). Data are presented as mean values of three independent MEF lines per genotype ±SD. Note that these DMRs were also bound by GADD45α in ChIP-seq analysis of Figure 3. (*) P < 0.05; (**) P < 0.01; (***) P < 0.001.

