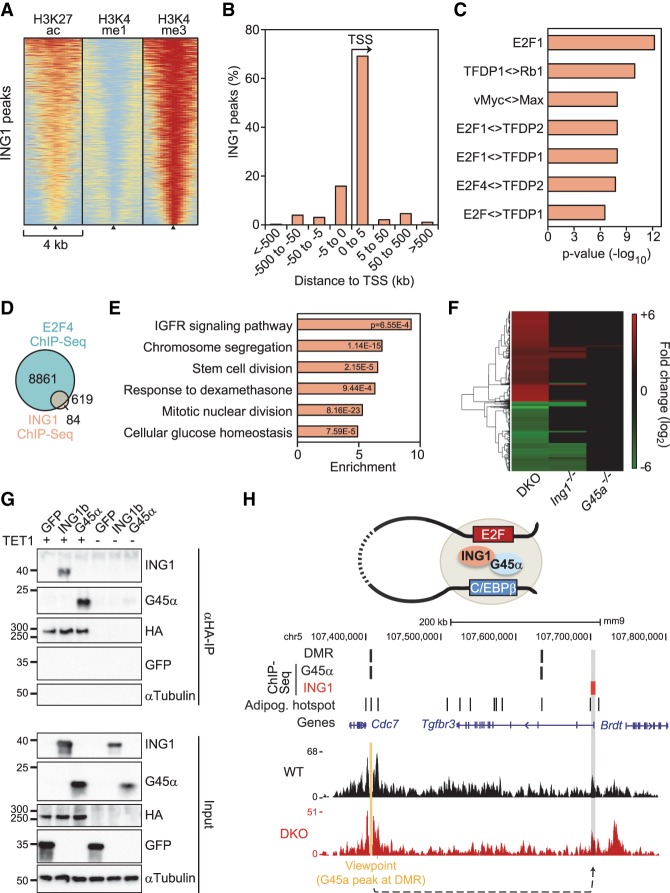
Figure 4.
ING1 binds to promoters that can loop to GADD45a-bound hypomethylated superenhancers. (A) Heat maps of H3K27ac, H3K4me1, and H3K4me3 histone marks of MEFs (Yue et al. 2014) centered on ING1-binding sites (black triangles). n = 703. Data are from ChIP of HA-Ing1 in transfected MEFs and are sorted based on the cumulative signal intensity of histone marks around ING1-binding sites. The red–yellow–blue key indicates high to low ChIP-seq signal. (B) Distance of ING1-binding sites to adjacent TSSs in percent. (C) TF-binding motif analysis of ING1-binding sites and associated P-values relative to genomic background. (Diamond) Predicted binding of dimers/multimers of the indicated proteins. (D) Overlap between E2F4-binding sites in 3T3-L1 cells (MacIsaac et al. 2010) and ING1-binding sites. (E) GO enrichment of genes neighboring ING1-binding sites, with corresponding P-values. The full list of GO enrichments is shown in Supplemental Table S3. (F) Heat map of ≥1.5-fold down-regulated (green) and up-regulated (red) genes in Gadd45a−/−, Ing1−/−, and double-knockout MEFs at a false discovery rate (FDR) of 10%. The full list of deregulated genes is displayed in Supplemental Table S4. (G) Immunoblot analysis of coimmunoprecipitation (co-IP) experiments using protein lysates of HEK293T cells transiently transfected with GFP, myc-GADD45α, or myc-ING1b with or without Flag-HA-TET1. αTubulin and GFP served as specificity controls. Input shows 2% of lysate was used for immunoprecipitation. (H, top) Model depicting chromatin looping between distant GADD45α - and ING1- bound genomic regions. (Middle) GADD45α and ING1 ChIP-seq peaks, hypermethylated DMRs (identified in Gadd45a/Ing1 double-knockout MEFs), and adipogenic hot spots (based on Siersbaek et al. 2014). (Bottom) NG Capture-C-seq (next-generation Capture-C combined with sequencing) interaction profile of a representative wild-type and double-knockout MEF line in a 450-kb genomic region on chromosome 5. The interaction between the GADD45α-bound viewpoint (orange) and the Tgfbr3 promoter bound by ING1 is highlighted (gray shading). For NG Capture-C interaction profiles of all wild-type, Gadd45a−/−, Ing1−/−, and double-knockout MEFs in triplicates for this region, see Supplemental Figure S3F.

