Figure 5.
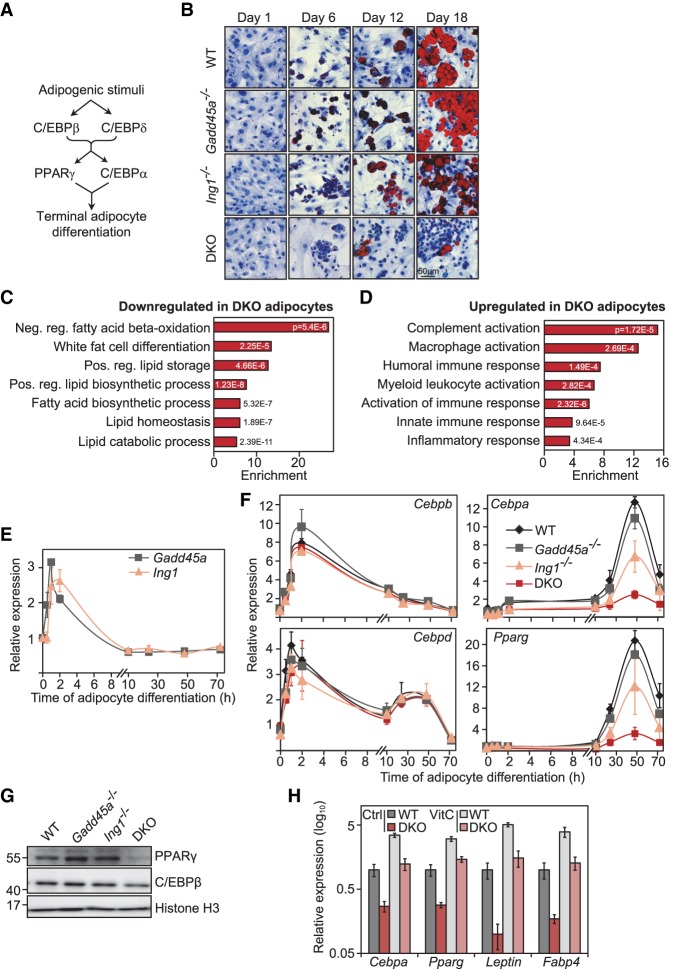
GADD45α and ING1 are required for adipocyte differentiation. (A) Scheme of key TFs induced during adipocyte differentiation and their causal connections. (B) Adipocyte differentiation assays using MEFs. Wild-type, Gadd45a−/−, Ing1−/−, and Gadd45a/Ing1 double-knockout MEFs (n = 4 individual MEF lines per genotype) were differentiated to adipocytes. At the indicated time points of differentiation, cells were stained with Oil Red O (red) to visualize lipid droplets and with hematoxylin (blue) as a counterstain. Representative images are shown. (C,D) GO enrichment of transcriptome changes during adipocyte differentiation. RNA-seq was conducted in wild-type, Gadd45a−/−, Ing1−/−, and double-knockout MEFs differentiated for 6 d along the adipogenic lineage. GO annotations of genes more than twofold down-regulated (C) or more than twofold up-regulated (D) at 10% FDR in double-knockout compared with wild-type cells are shown. The full list of GO enrichments is shown in Supplemental Table S6. (E) qPCR analysis of Gadd45a and Ing1 expression during the time course of MEF-to-adipocyte differentiation. Data are presented as mean values of three independent wild-type MEF lines ±SD. (F) qPCR expression analysis of the key TFs Cebpb, Cebpd, Cebpa, and Pparg during the time course of MEF-to-adipocyte differentiation. Data are presented as mean values of three independent MEF lines per genotype ±SD. (G) Immunoblot analysis of PPARγ and C/EBPβ at day 6 of MEF-to-adipocyte differentiation. Representative blot of n = 3 independent cell lines per genotype. (H) RT-qPCR expression analysis of the indicated adipocyte marker genes at day 6 of MEF-to-adipocyte differentiation in the indicated genotypes and vitamin C treatment (VitC). Data represent mean values of three independent MEF lines per genotype ±SD.

