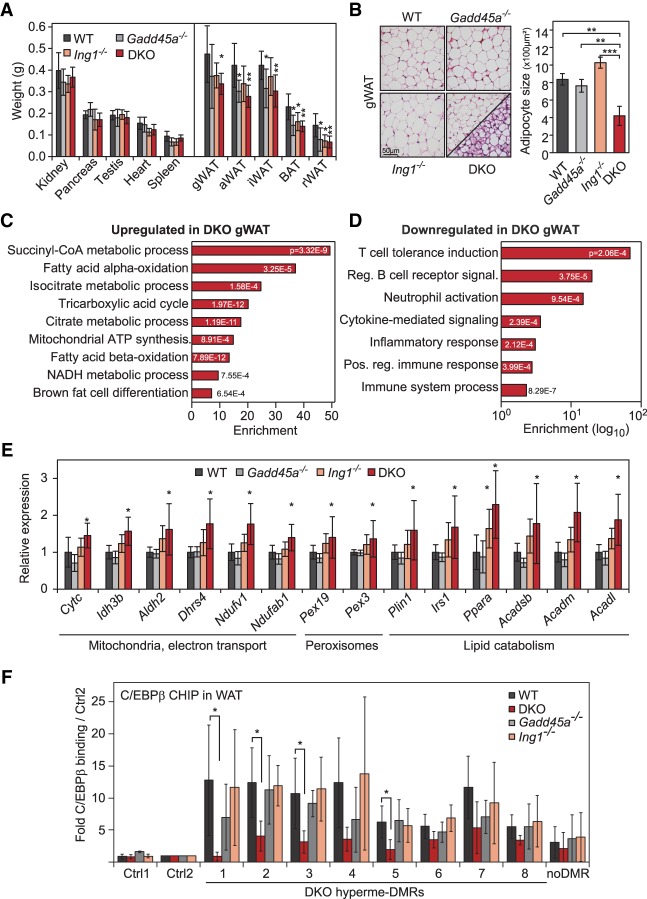
Figure 6.
Lipodystrophy in Gadd45a/Ing1 double-knockout mice. (A) Weights of control organs (left) and adipose tissue depots (right) of 8-wk-old male mice. (gWAT) Gonadal WAT; (aWAT) axillary WAT; (iWAT) inguinal WAT; (BAT) interscapular BAT; (rWAT) retroperitoneal WAT. n = 5–8 animals per genotype. (DKO) Gadd45a/Ing1 double knockout. (B) Histological analysis of adipocyte abnormalities. (Left) H&E staining of gonadal WAT (gWAT) sections. The panel displaying double-knockout gWAT morphology is divided to display two areas with distinct morphological appearances: classical WAT-like morphology (top left) and beige/brite adipocyte islands (bottom right). (Right) Individual adipocyte cell size in gWAT was quantified by measurement of >200 adipocytes on each section. n = 4–5 mice per genotype. (C,D) GO enrichment and corresponding P-values of genes up-regulated (C) or down-regulated (D) ≥1.5-fold in double-knockout gWAT compared with wild-type gWAT. The full list of GO enrichments is shown in Supplemental Table S7. (E) qPCR confirmation of gWAT gene expression changes in independent animals of the indicated genotypes. n = 5–9 per genotype. (F) ChIP-qPCR of endogenous C/EBPβ in gWAT of wild-type or Gadd45a or Ing1 single-knockout or double-knockout mice. qPCR was conducted on eight DMRs hypermethylated in MEFs (Fig. 2I), an unrelated C/EBPβ target region (Siersbaek et al. 2014), and two independent negative control regions (Ctrl1–2). Data are presented as mean values of paralleled ChIPs using gWAT of independent animals ±SD. n = 5 for wild-type and double-knockout; n = 4 for Gadd45a or Ing1 single knockouts. Data of A, B, E, and F are presented as mean values of the indicated number of samples ±SD. (*) P < 0.05; (**) P < 0.01.

