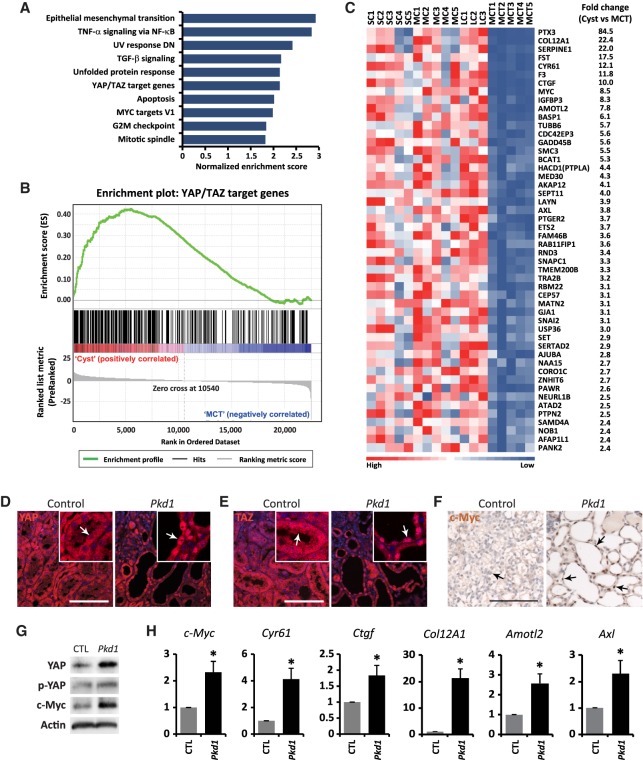
Figure 1.
Activation of YAP in human ADPKD and mouse Pkd1 mutant kidney cysts. (A) Gene set enrichment analysis showing the 10 most significantly enriched signaling pathways by normalized enrichment score in ADPKD cysts compared with minimally cystic tissues. (B) Gene set enrichment analysis of ADPKD cysts versus minimally cystic tissues for the expression of previously reported direct YAP/TAZ target genes. Normalized enrichment score = 2.1389; false discovery rate q = 0.0000. (C) Heat map analysis of 50 direct YAP/TAZ target genes with the most up-regulation in human ADPKD cysts compared with minimally cystic tissues. Tissues from different patients were analyzed. (SC) Small cyst; (MC) medium cyst; (LC) large cyst; (MCT) minimally cystic tissue. The fold change represents the ratio of gene expression in cysts (mean of 13 cysts, including five small cysts, five medium cysts, and three large cycts) over minimally cystic tissues (mean of five minimally cystic tissues). (D–F) YAP (D), TAZ (E), and c-Myc (F) staining in control (Pkd1flox/flox) and Pkd1 mutant (AhCre;Pkd1flox/flox) kidneys at postnatal day 15 (P15). Animals received daily injections of β-naphthoflavone (β-NF) from P8 to P11. Note the cytoplasmic localization of YAP and TAZ in control tubular epithelium and nuclear localization of YAP and TAZ in Pkd1 mutant kidney cysts (compare arrows in the magnified insets). Also note the nuclear staining of c-Myc in Pkd1 mutant kidney cysts, which is absent in the control tubular epithelium (arrows). Bar, 100 µm. (G) Western blot showing increased total YAP and c-Myc protein levels and relatively decreased phosphorylation of YAP (the ratio of p-YAP over YAP) in Pkd1 mutant kidneys. (H) Up-regulation of direct YAP/TAZ target genes in Pkd1 mutant kidneys. Data are mean ± SD. n = 3. (*) P < 0.01, t-test. (G,H) Control and Pkd1 mutant mice received daily injections of β-NF from P8 to P11 and were analyzed at P15.

