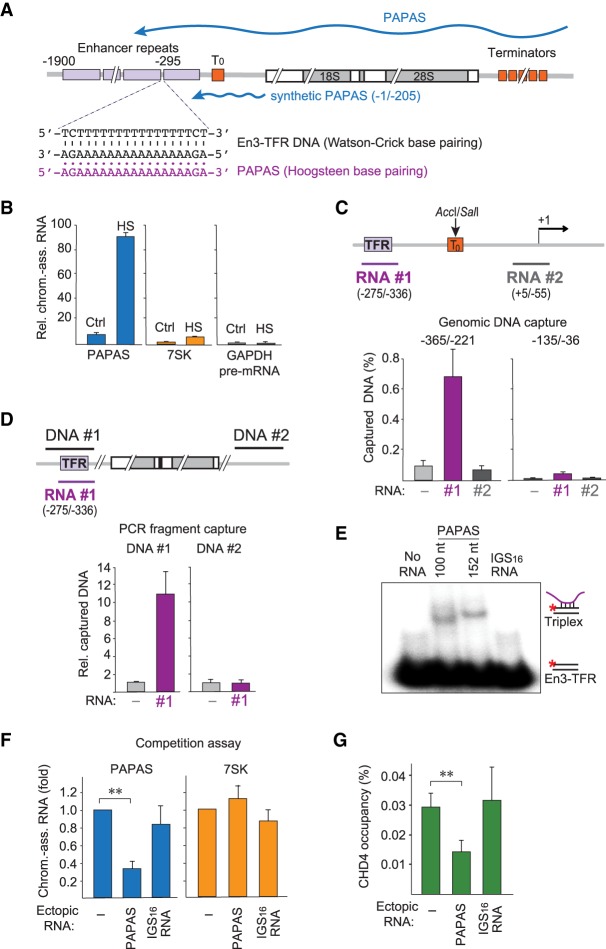
Figure 4.
PAPAS is tethered to rDNA by DNA–RNA triplex formation. (A) Schematic representation of a murine rDNA transcription unit. Enhancer repeats are depicted as purple boxes, and terminator elements are shown as orange boxes. The 3′-terminal part of PAPAS used to study CHD4 interactions (−1/−205) is indicated by a blue line. The En3-TFR and the corresponding PAPAS sequences are shown below. (B) RT-qPCR comparing the levels of chromatin-bound PAPAS (−36/−135), 7SK, and GAPDH pre-mRNA from control (Ctrl) and heat-shocked (HS) NIH3T3 cells. Values were normalized to 18S rRNA. n = 3. (C) DNA capture assay showing binding of genomic DNA digested with AccI and SalI to biotinylated PAPAS fragments #1 and #2. PAPAS-associated DNA was monitored by qPCR amplifying rDNA sequences −365/−221 and −135/−36. Data represent DNA recovery normalized to input. n = 3. The locations of the two RNAs used for the capture experiment are depicted by a purple and a gray line. (D) Binding of biotinylated PAPAS (−275/−336) to PCR fragments #1 and #2 comprising En3-TFR (−365/−221) and intergenic spacer (IGS16) sequences. PAPAS-associated DNA was monitored by qPCR. Data represent DNA recovery normalized to samples without RNA. n = 3. (E) Synthetic RNAs comprising PAPAS sequences −234/−333 or −182/−333 and a control RNA (IGS16 RNA) were incubated with 0.25 pmol of a double-stranded 32P-labeled exonuclease I-treated oligonucleotide comprising En3-TFR (Supplemental Table S1), and formation of DNA–RNA triplexes was monitored by electrophoretic mobility shift assay (EMSA). (F) Competition experiment showing that transfection of synthetic RNA comprising the En3-TFR sequence (−275/−336) reduces binding of heat-induced endogenous PAPAS (−234/−333) to chromatin. Values are displayed relative to mock transfected cells. n = 3. (G) ChIP-qPCR monitoring CHD4 occupancy in heat-shocked NIH3T3 cells transfected with synthetic PAPAS or IGS16 RNA as in F. Values were normalized to input. n = 3. Data are presented as mean ± SEM.

