Figure 7.
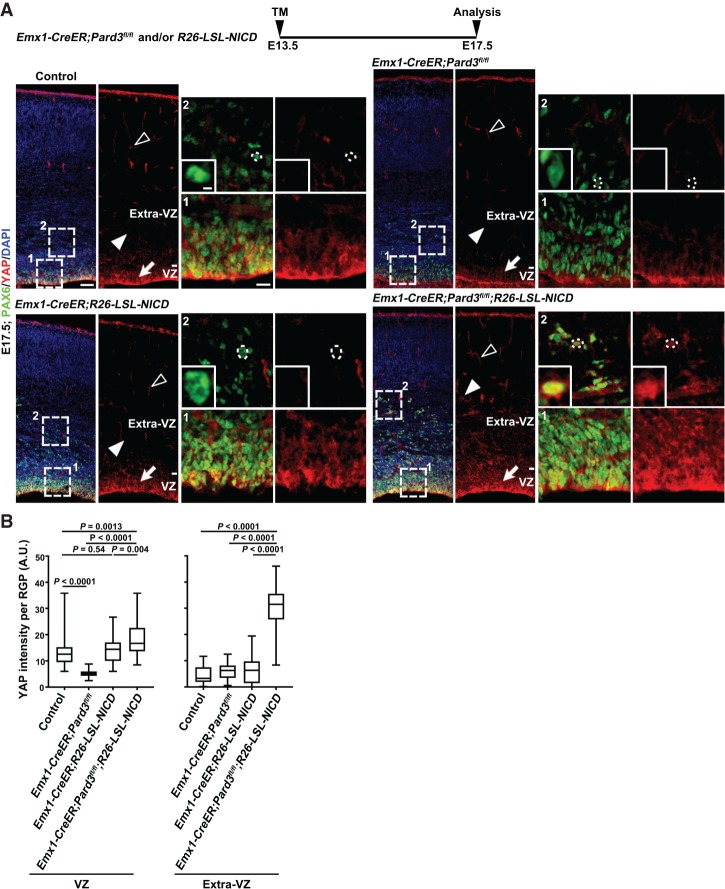
PARD3 and NOTCH signaling work synergistically to regulate HIPPO signaling. (A) Representative confocal images of E17.5 control (top left), Emx1-CreER;Pard3fl/fl (top right), Emx1-CreER;R26-LSL-NICD (bottom left) and Emx1-CreER;Pard3fl/fl;R26-LSL-NICD (bottom right) cortices stained for PAX6 (green) and YAP (red) and counterstained for DAPI (blue). A schematic protocol of TM induction is shown at the top. High-magnification images (dashed squares) of the RGPs in the VZ and extra-VZ (filled arrows and arrowheads and insets) are shown at the right. Open arrowheads indicate YAP signal in the blood vessel. Dashed circles indicate the cell bodies of representative RGPs in the extra-VZ. High-magnification images are shown in the insets. Note that the VZ and ectopic PAX6+ cells in the Emx1-CreER;Pard3fl/fl;R26-LSL-NICD cortex exhibit a strong YAP staining signal. Bars: left, 50 µm; right, 15 µm; inset, 5 µm. (B) Quantification of the YAP staining signal intensity per RGP in the VZ (left) and extra-VZ (right) at E17.5. n = 3 brains per genotype; unpaired two-tailed t-test with Welch's correction. (A.U.) Arbitrary unit. In the box and whisker plot, the center line indicates the median, the box indicates the interquartile range, and the whiskers indicate minimum and maximum.

