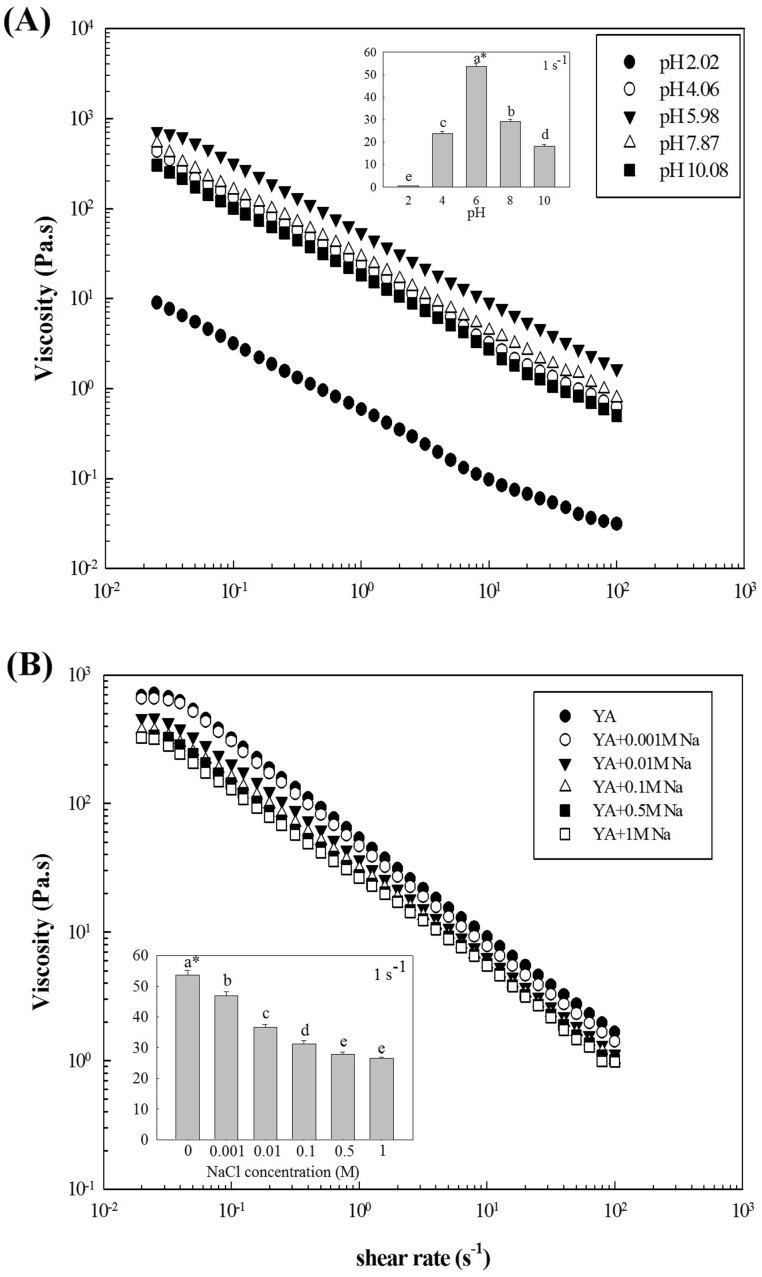
Fig. 2.
Steady shear flow curves of YA-composite gels with an AP concentration of 0.8% at different pHs (A) or NaCl concentrations (B). AP Auricularia auricula-judae polysaccharide, YA yam starch, and A. auricula-judae polysaccharide composite, *Values of apparent viscosity at 1 s−1 followed by different letters (a–e) above each histogram for different pHs or different NaCl concentrations are significantly different at p < 0.05 by Duncan’s multiple-range test

