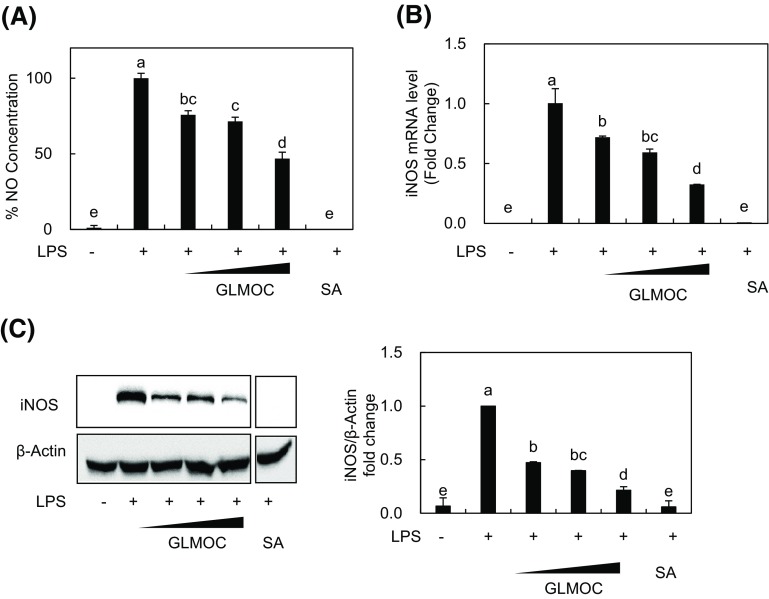
Fig. 1.
GLMOC suppressed iNOS expression and NO synthesis in LPS-induced RAW264.7 cells. (A) The produced NO was measured with NO assay. The cells (4 × 10⁴/well in 96-well plate) were pretreated with GLMOC or SA for 2 h, and then LPS (100 ng/mL) for 22 h. (B) The relative amount of iNOS mRNA was measured with quantitative RT-PCR. The cells (8 × 10⁵ cells in a 60 mm dish) were pretreated with GLMOC or SA for 2 h, and then LPS for 10 h. (C) The protein levels of iNOS and β-actin were determined by Western blot. The cells (8 × 10⁵ cells in a 60 mm dish) were pretreated with GLMOC or SA for 2 h, and then LPS (100 ng/mL) for 22 h. Values represent the mean ± SD. Different lowercase letters indicate significant differences at p < 0.05. GLMOC (50, 100, and 300 μg/mL), SA (sulforaphane, 10 μM), LPS (100 ng/mL)

