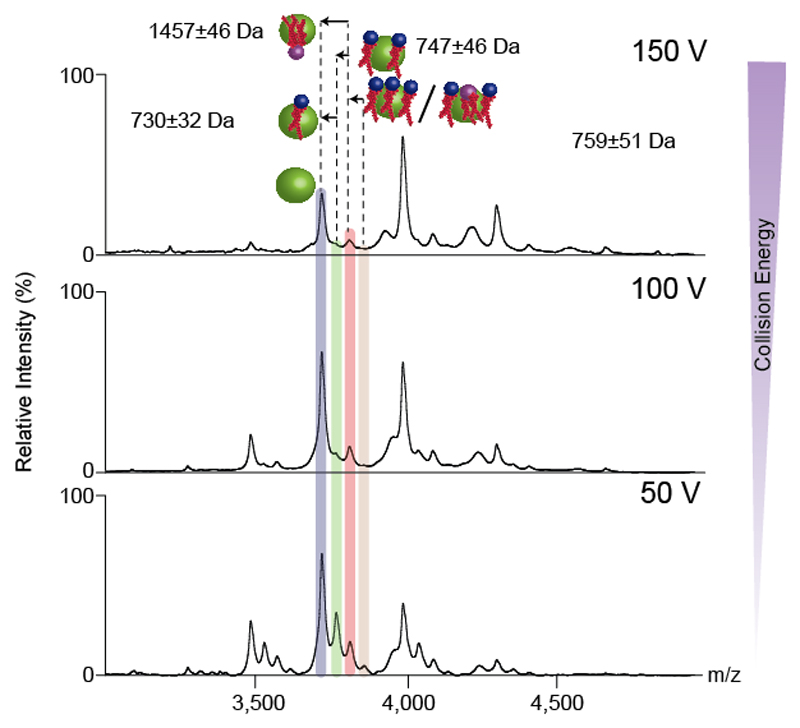
Figure 6. HE-nMS of dimeric lipid bound LeuT.
Lipid identification of LeuT through identification of the satellite peaks bound to the stripped monomer species generated through MS/MS of the lipid bound dimeric state (as shown in Figure 4c). The satellite peaks correspond to three PL and one CDL bound to each monomer. The masses of the lipids are calculated by subtracting the masses of the apo and lipid bound states. The errors in the masses of lipids determined represent the sum of the errors incurred in measuring masses of the individual peaks. The spectra were obtained for the dimeric LeuT in OG. Phospholipids and cardiolipins are represented with blue and purple spheres respectively. The relative sizes of the protein and lipids are not scaled.

