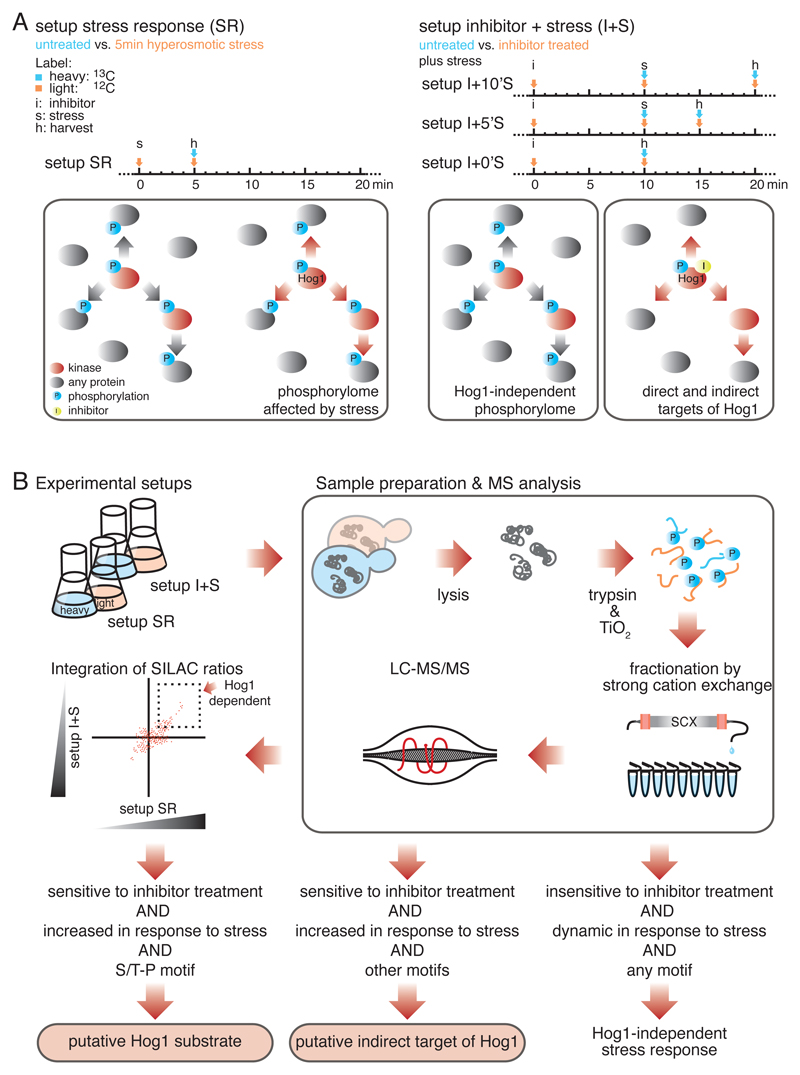
Fig. 1.
A two-step quantitative proteomics strategy to identify substrates of MAPK Hog1. A) Timing diagram (above) and schematic illustration (below) of the two experimental setups. In setup SR (left), global changes in the yeast phosphorylome in response to hyperosmotic stress were determined, n = 6 biological replicates. In setups I+0’S, I+5’S, and I+10’S (right), Hog1 was inactivated by an analogue sensitive (as) inhibitor followed by hyperosmotic stress treatment for zero, five or ten minutes, respectively. n = 2 biological replicates for each of the three experimental setups. Stress activated kinases are indicated in red and phosphorylation events in blue. The yellow dot indicates as-inhibitor. B) Schematic illustration of the applied workflow. Phosphorylation events displaying a more than twofold increase or decrease in abundance between SR and I+S setups were considered significant changes. Phosphorylated S/T-P motifs that increase in abundance in response to stress and show sensitivity to inhibitor treatment were considered putative substrates of Hog1.

