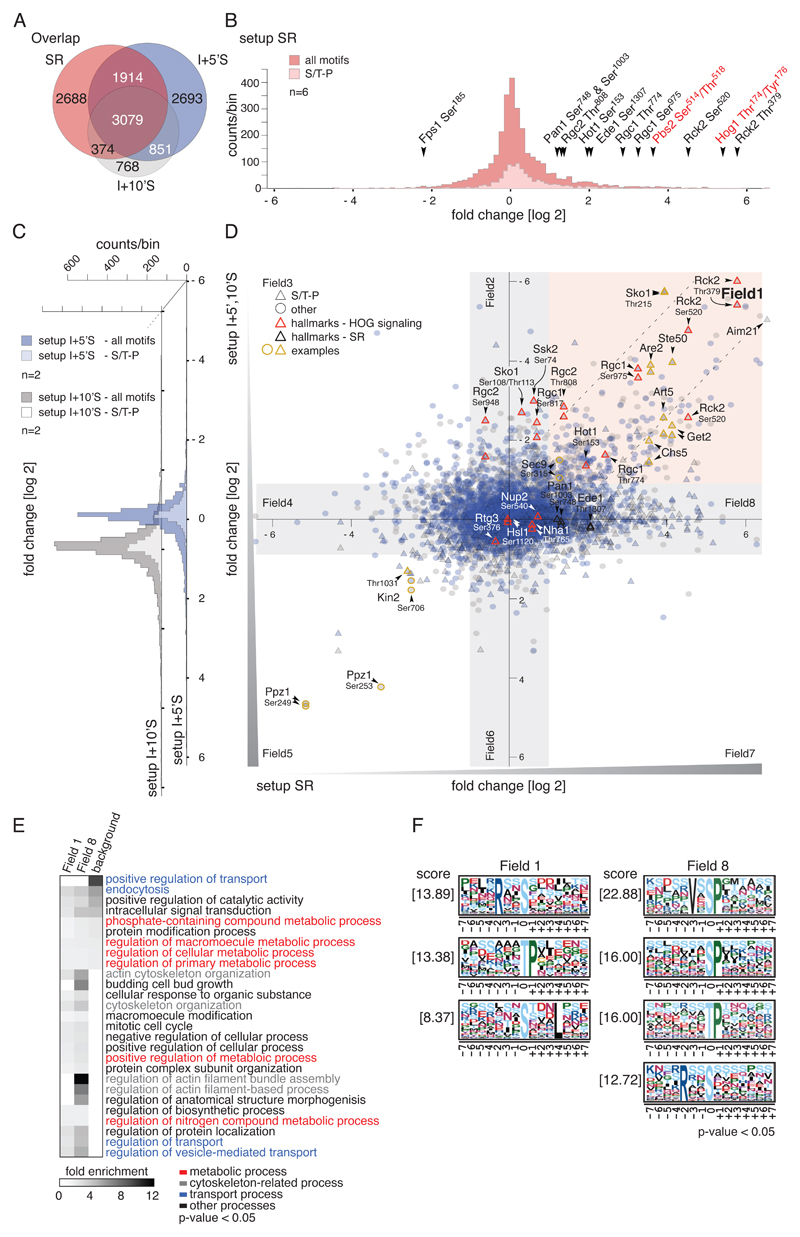
Fig. 2.
Effects of hyperosmotic stress and Hog1-inhibition on the S.cerevisiae phosphorylome. A) Venn diagram showing the overlap of unique phosphorylation sites between setups SR (n=6), I+5’S (n=2) and I+10’S (n=2). B) Histogram of SILAC ratios of quantified sites in setup SR. Light pink bins indicate the distribution of S/T-P motifs, and dark pink bins indicate other motifs. Ratios are log2-transformed. Hallmarks of osmostress and HOG signaling are highlighted with arrowheads; key residues of the MAPK Hog1 and MAPKK Pbs2 are indicated in red. C) Distribution of SILAC ratios of quantified sites in setups I+5’S (blue bins) and I+10’S (grey bins). S/T-P motifs: light blue and light grey bins, respectively; other motifs: dark blue and dark grey bins, respectively. Ratios are log2-transformed. D) Scatter plot overlaying SILAC ratios of setups SR, I+5’S, and I+10’S. X-axis: setup SR. Y-axis: setups I+5’S (blue) and I+10’S (grey), respectively. S/T-P motifs: triangles, other motifs: circles. Red outlines indicate hallmarks of HOG signaling; yellow outlines indicate examples discussed in the text. Ratios are log2-transformed. E) Heatmap of overrepresented GO terms in the individual fields defined in (C). Fold enrichment of biological processes, p-value < 0.05. Background: S. cerevisiae proteome. F) Overrepresented motifs in the individual fields were detected with MotifX, p-value < 0.05 (see also fig. S1C).

