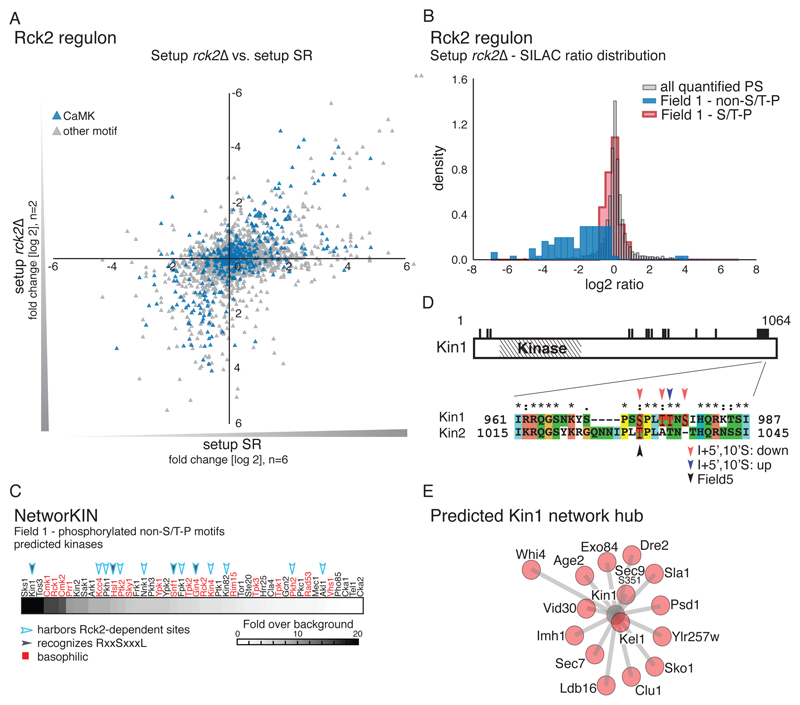
Fig. 3.
The kinase Rck2 is a major effector of HOG signaling. A) Scatter plot comparing distribution of quantified phosphorylation sites between setup rck2∆ (SILAC ratio: rck2∆ (light): wild-type (heavy), both treated with NaCl (n=2)) and setup SR (n=6). B) Histogram showing the distribution of SILAC ratios of quantified sites in setup rck2∆. Red: Field 1 S/T-P motifs. Blue: Results for Field 1 non-S/T-P motifs. Grey: all quantified phosphorylation sites (PS). C) Prediction of kinases involved in the regulation of the indirect targets of Hog1. Basophilic kinases are indicated in red. Filled arrowheads: kinases recognizing S-X-X-X-L motifs. Open arrowheads: kinases containing Rck2-dependent phosphorylation sites. D) Diagram showing phosphorylated residues (black bars) of the kinase Kin1. Inset illustrates the conserved S/T-P motifs in Kin1 and Kin2, which include an as-inhibitor–sensitive serine (Ser973 in Kin1, black arrowhead). Phosphorylation at highlighted residues was either decreased (red arrowheads) or increased (blue arrowhead) upon inhibitor treatment or associated with Field 5 (black arrowhead). (E) Predicted interactions between Kin1 (grey) and substrates (red) interactions based on NetworKIN analysis. The relative length of each edge was calculated according to NetworkKIN scores: the closer to the kinase, the higher the score.

