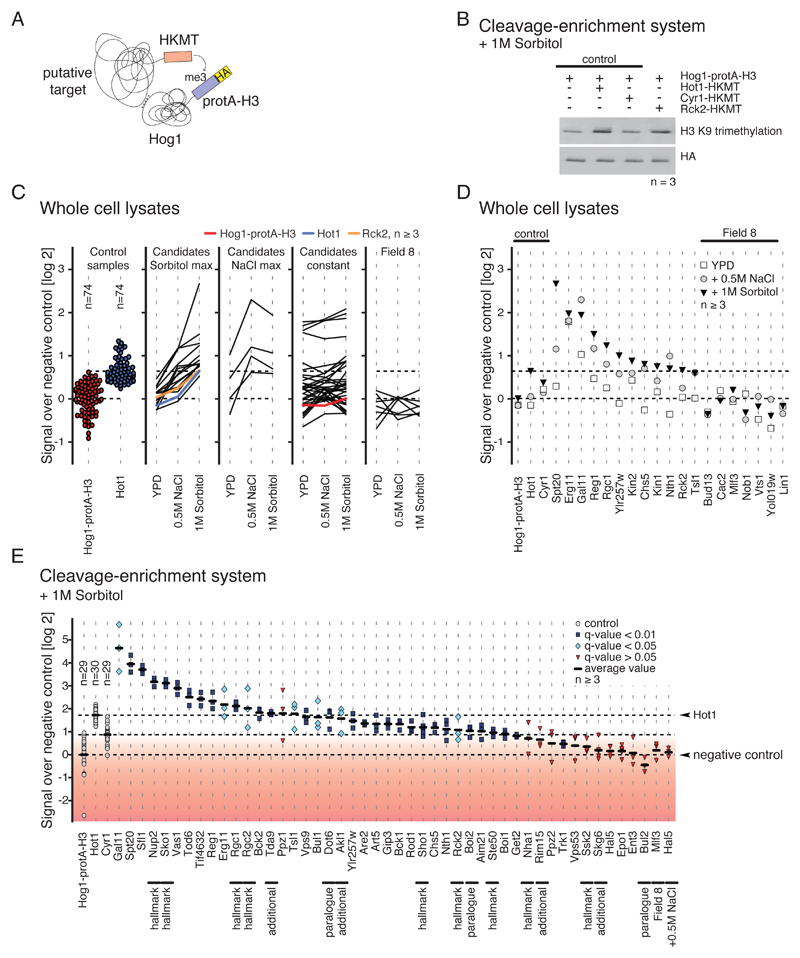
Fig. 4.
Validation of kinase-substrate interactions. A) Cartoon illustrating the M-track protein-protein proximity assay. Hog1 (prey) is tagged with protA-H3 which gets permanently methylated when in close proximity to a putative target protein (bait) that is fused to an active domain of an histone lysine methyltransferase (HKMT). B) Representative Western blot showing M-track results obtained for Rck2 generated using cleavage-enrichment system. n≥3 replicates per sample. C) M-track proximity signals in whole cell extracts, comparing unstressed conditions to conditions of increased NaCl and sorbitol concentration. Each line corresponds to one protein. n ≥3 replicates per sample per condition. From left to right: loading controls, candidate proteins with maximum induction under sorbitol treatment, candidate proteins with maximum induction under NaCl treatment, candidate proteins that were not induced by sorbitol or NaCl, proteins derived from Field 8. Ratios are log2-transformed. D) Detailed proximity signals for tested targets described in the main text. n≥3 replicates per sample. Ratios are log2-transformed. E) Quantification of proximity signals. n ≥3 replicates per sample. Black lines indicate average proximity signal. Proximity signals that differ significantly from background are marked in light blue (q-value < 0.05, > 0.01) and blue (q-value < 0.01). The red gradient indicates low confidence based on q-values. One-tailed Welch’s t-test was applied and p-values were corrected for multiple testing by the Benjamini-Hochberg procedure. Proteins that were picked for validation based on less stringent criteria are marked with "additional".

