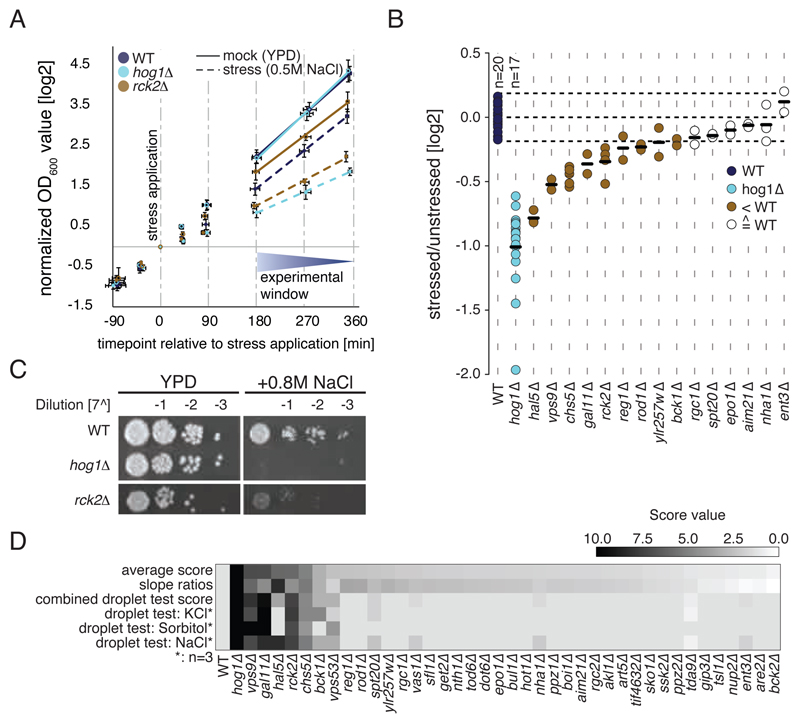
Fig. 5.
Characterization of osmosensitive phenotypes. A) Growth curves (log2-transformed) of wild-type, hog1∆, and rck2∆ cells in the absence of hyperosmotic stress and following induction of hyperosmotic stress. B) Stressed:unstressed (mock) ratios of log-transformed growth curve slopes depicted in (A), n ≥2 replicates per sample. (C) Serial dilution droplet test of the individual deletion mutants on YPD plates containing 0.8M NaCl. YPD: control. Only results obtained from rck2Δ cells are shown. (D) Heatmap illustrating scaled scores from dilution droplet tests under different conditions and growth curve analysis (slope score). Rows are sorted according to combined average score (0–10).

