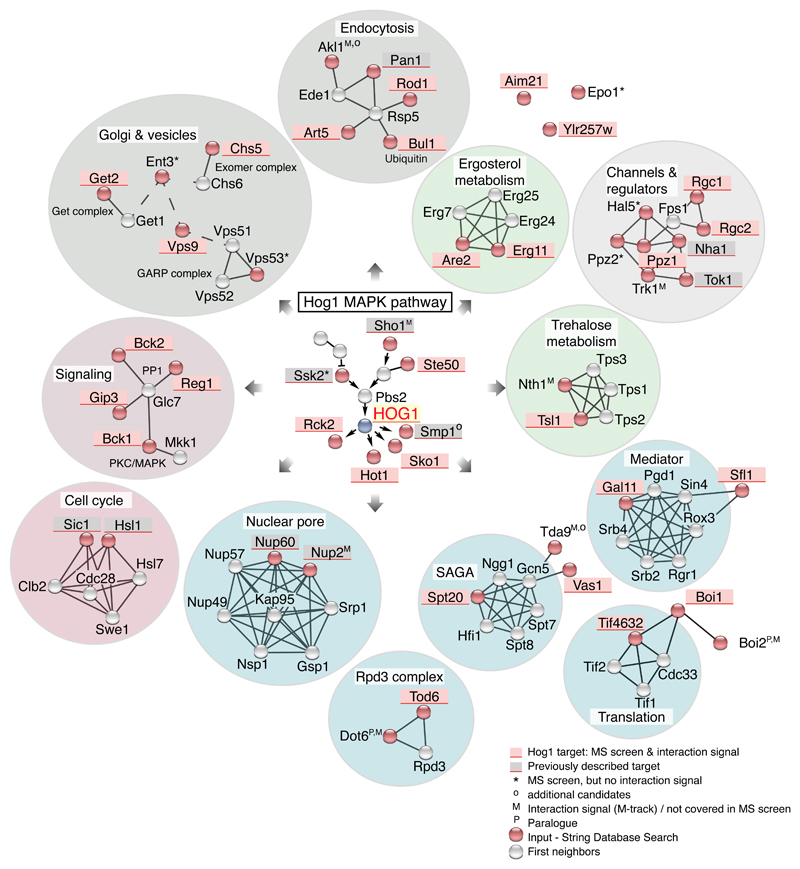
Fig. 6.
Hog1 network based on STRING. Putative target proteins involved in the indicated cellular processes of Hog1 are shaded in red (Field 1 plus positive proximity signal). Previously described Hog1 substrates not included in our analysis are shaded in grey. Red circles indicate protein targets derived from the shotgun screen, with grey circles indicating their first neighbor according to STRING. Shaded circles enclosing proteins highlight functional groups, such as metabolism (green) and gene-expression related processes (blue).

