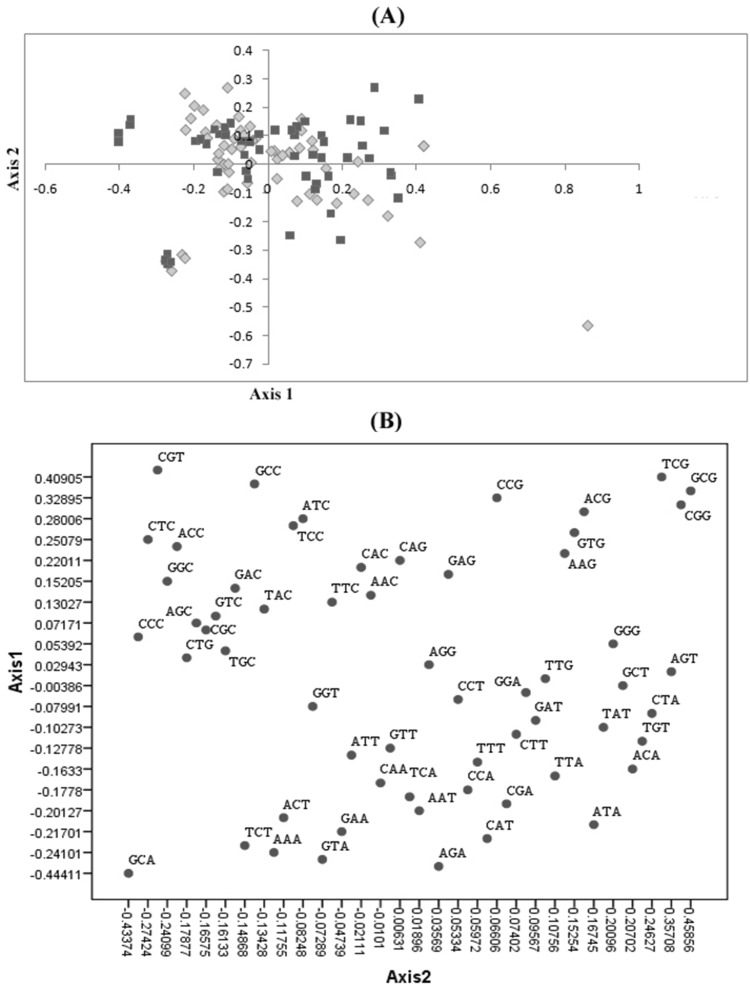
Fig. 5.
(A) Distribution of B. campestris genes on the plane defined by the first two main axes of the correspondence analysis. Red colored squares and yellow colored diamonds indicate genes with extremely high and low CAI values used as the High and Low datasets, respectively. (B) The distribution of codons on axis 1 versus axis 2. Each codon with A or T at third synonymous codon position showed negative axis 1 value in correspondence analysis

