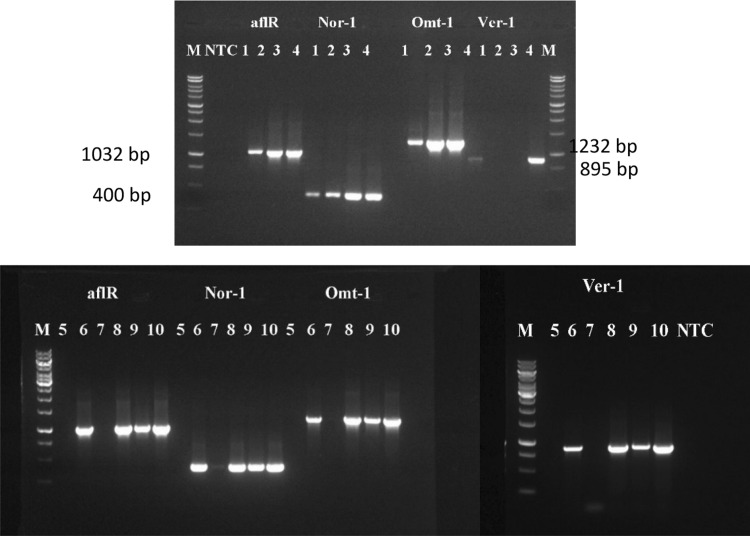
Fig. 1.
Detection of genes involved in toxin production using PCR and gel electrophoresis. Bands represent amplified fragments of fungal DNA (aflR = 1032 bp, nor-1 = 400 bp, omt-1 = 1232 bp, and ver-1 = 895 bp). DNA was extracted from A. flavus AF4 (line 1), 5AF4 (line 2), AF6 (line 3), 5AF6 (line 4), AF3 (line 5), 10AF3 (line 6), AF11 (line 7), 5AF11 (line 8), AF12 (line 9), and 15AF12(line 10). M = marker ladder and NTC (no primer or template control)

