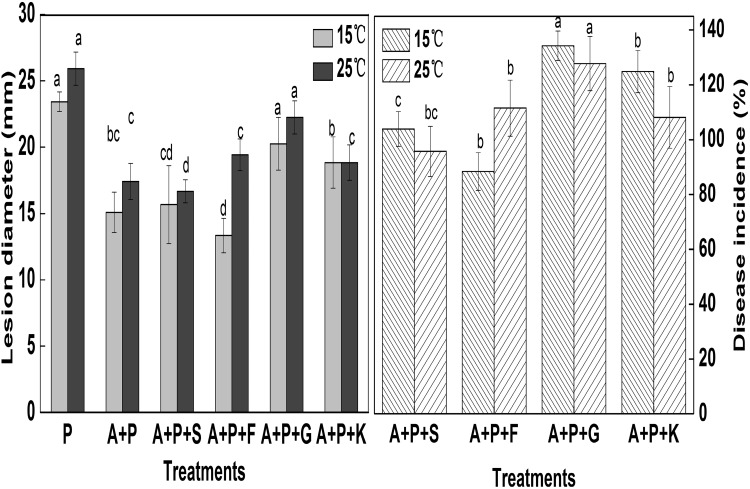
Fig. 3.
The diameters of the lesions (left) and the disease incidence (right) of all treatments. P pathogen, A antagonist, S sucrose, F fructose, G glucose, K potassium nitrate. Each value is the mean of 3 experiments. Bars on the top of columns represent the standard error of the mean. Data in columns with the different letters are significantly different according to Duncan’s multiple range test at p = 0.05

