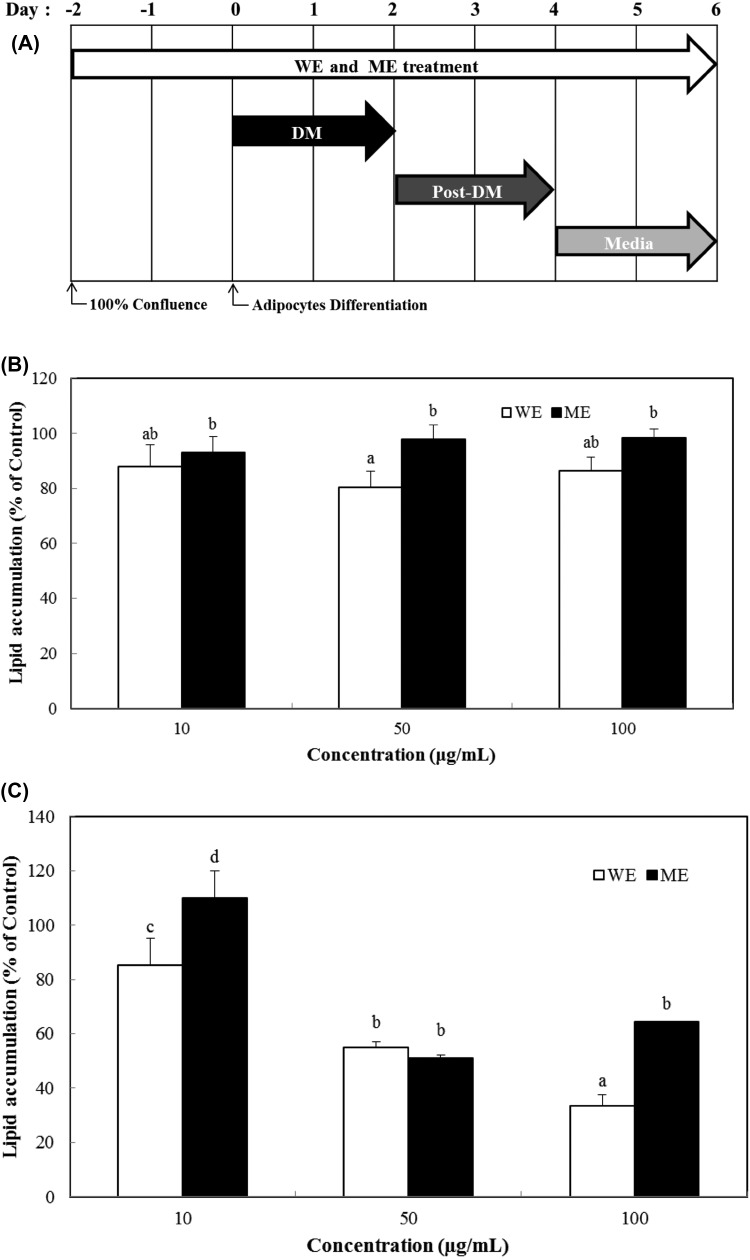
Fig. 3.
Effects of CCT extracts treatment on the adipogenesis in 3T3-L1 cells. Scheme of CCT (WE and ME) treatment and 3T3-L1 adipocytes differentiation (A). Lipid accumulation levels of 3T3-L1 adipocytes treated with WE and ME prepared from kernel (B) and shell (C) by ORO staining at day 6. Each value was expressed by mean ± SD. Values with different letters on the bars in each figure indicate significant differences by Duncan’s multiple range test at p < 0.05

