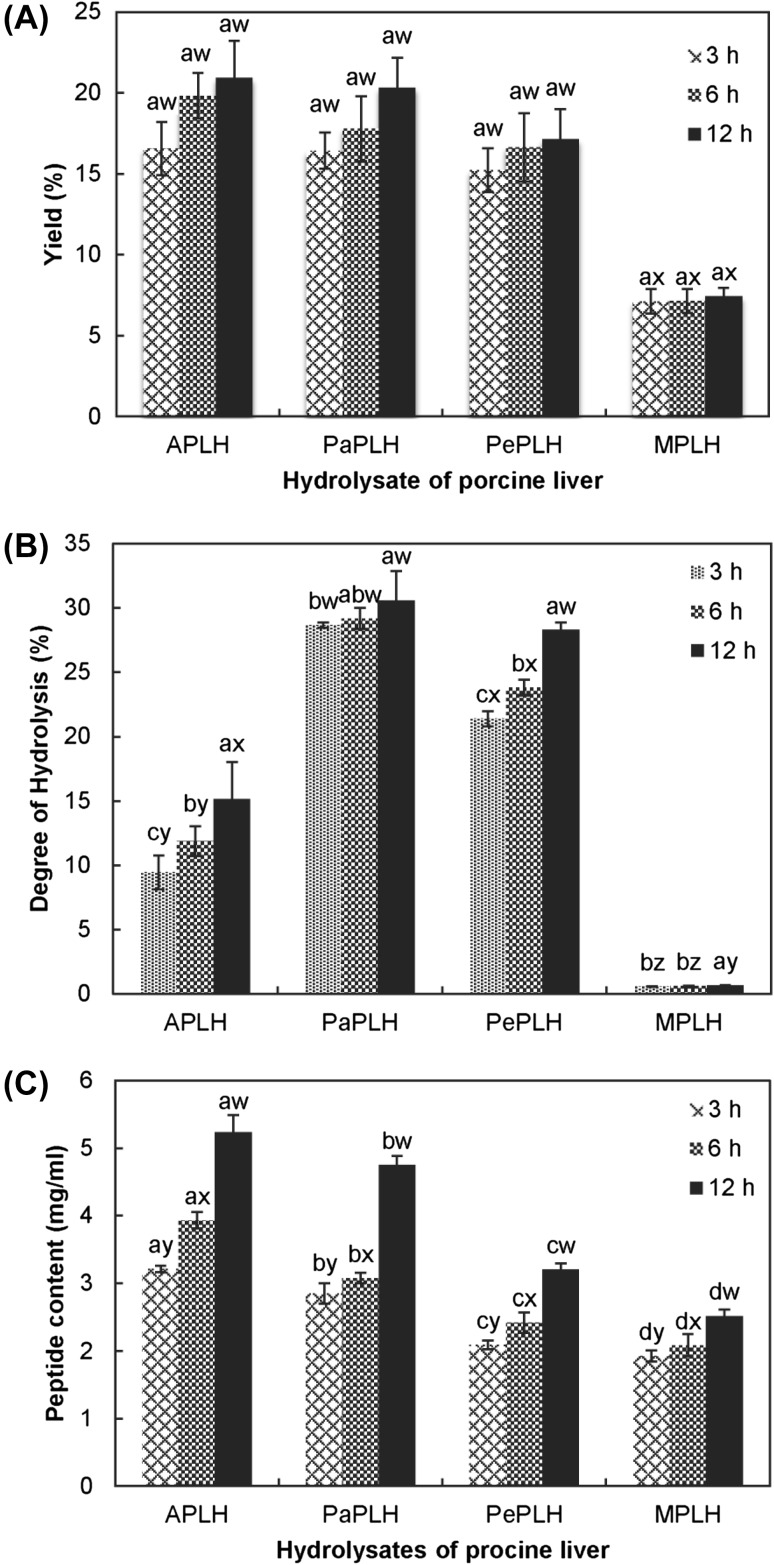
Fig. 1.
Yield (A), degree of hydrolysis (B), and peptide content (C) of porcine liver hydrolysates. The hydrolysis times are 3, 6, and 12 h. Letters a, b, and c indicate significant differences with the same protease (p < 0.05). Letters w, x, y, and z indicate significant differences with the same hydrolysis time (p < 0.05)

