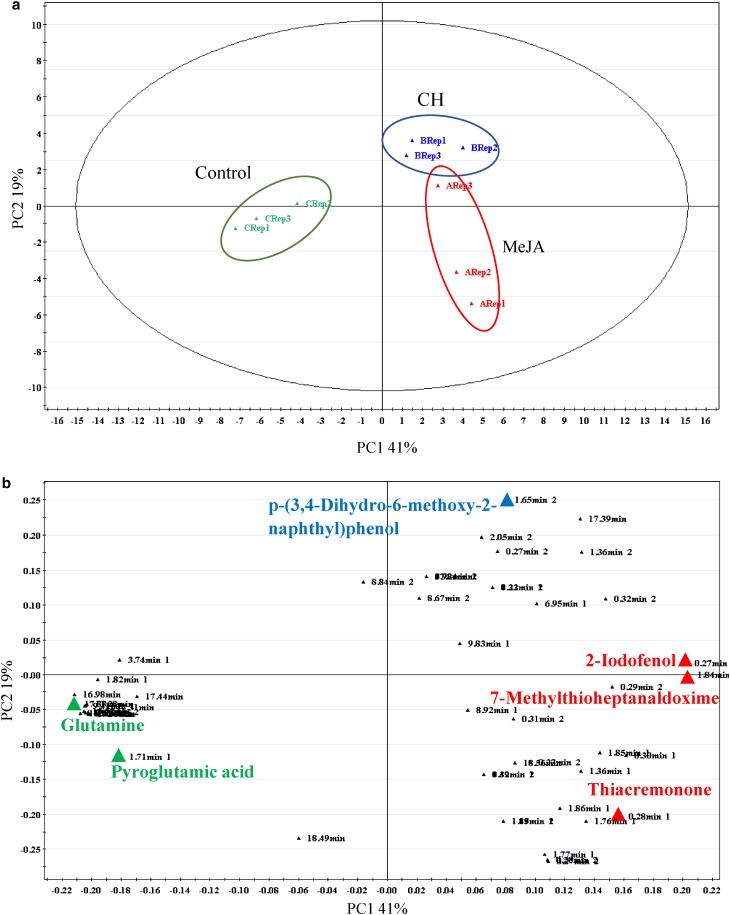
Fig. 3.
Principal component analyses of mangosteen untreated callus, callus treated with 100 µM MeJA and callus treated with 500 mg/L CH. a Score plot shows the metabolome clusters located at distinct positions of PC1 (41%) and PC2 (19%); b Loading plot for PC1 and PC2 with contributing mass peaks and their assignments, with each metabolite denoted by its mass/retention time pair

