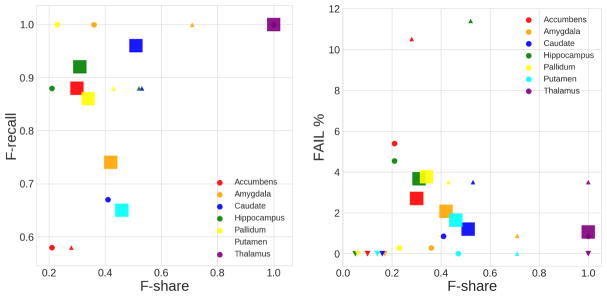
Fig. 2. Scatter plots of F-recall and actual FAIL case percentage vs. proportion of predicted FAIL cases on test datasets.
Left: F-share vs F-recall. Right: Fail F-share vs FAIL percentage. Mark size shows the dataset size. Mark shape represents dataset (site): ○ - CODE-Berlin (N=176); □ - Münster (N=1033); △ - Stanford (N=105); ▽ - Houston (N=195).

