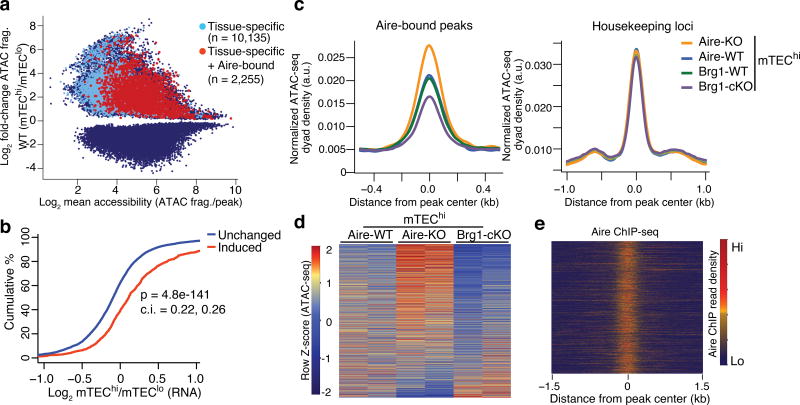
Figure 3.
Accessibility at tissue-specific loci are promoted by Brg1 and repressed by Aire. (a) MA plot of differential ATAC-seq peaks between mTEChi and mTEClo samples (blue), highlighted by those whose nearest gene is tissue-specific (light blue) and those that have Aire occupancy and neighbor tissue-specific genes (red). (b) CDF plot of the transcriptional fold-change between mTEChi and mTEClo at indicated loci classified by differential accessibility changes. P value from two-tailed Mann-Whitney U test with 95% confidence intervals. Representative of two independent experiments. (c) Density plots of ATAC-seq fragment dyads from mTEChi samples of indicated genotypes at Aire-bound, ATAC-seq peaks near tissue-specfic genes (left) or housekeeping genes (right). Representative of 2 independent experiments. (d) Heatmap of normalized ATAC-seq fragment dyad density between samples of indicated genotypes at mTEChi-induced, Aire-bound, tissue-specific loci. n = 2 independent independent experiments. (e) Heatmap of Aire ChIP-seq fragment dyad density at same regions as (d). Representative of 2 independent experiments.

