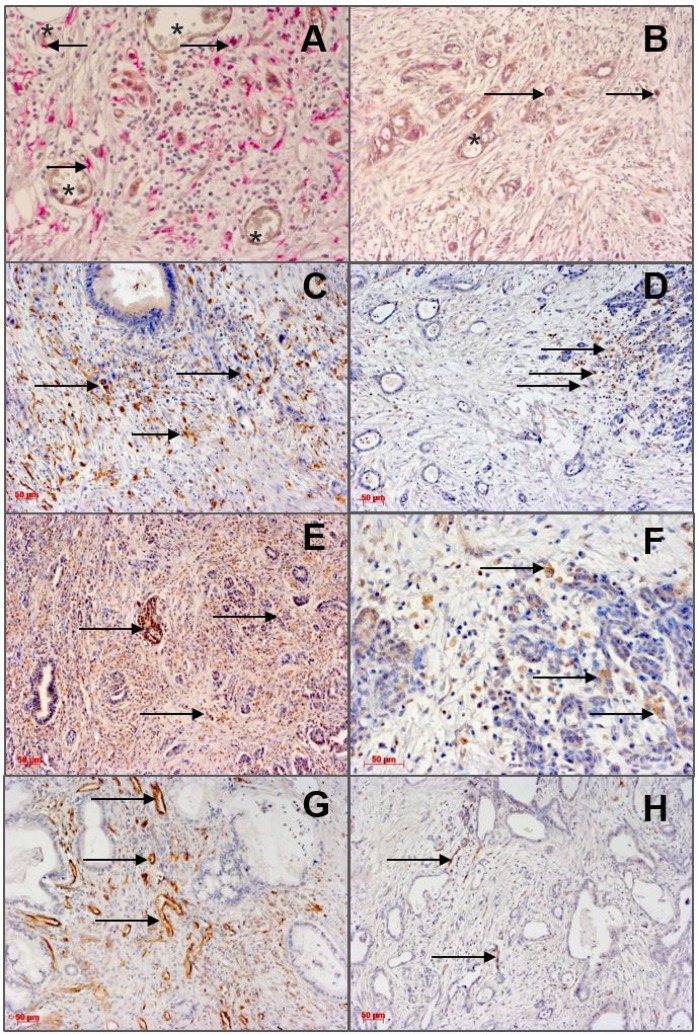
Figure 1. Immunohistological detection of angiopoietins and infiltrating monocytes/macrophages (left column: high density; right column: low density) in TCA of PDAC specimens.
Arrows indicate positive staining, asterisks indicate microvessels. Scale bar 50 µm. (A): High density of TIE2+ monocytes in the tumor central areas (TCA). PDAC revealed a homogenous infiltration pattern of these cells with preference for the perivascular areas. (B): Low density of TIE2+ monocytes (arrows). (C): High density of CD163+ TAMs. (D): Low density of CD163+ TAMs. (E) High Ang-2 expression. (F): Low Ang-2 expression. (G): CD31+- microvessels (high microvascular density, high MVD. (H): Low MVD.

