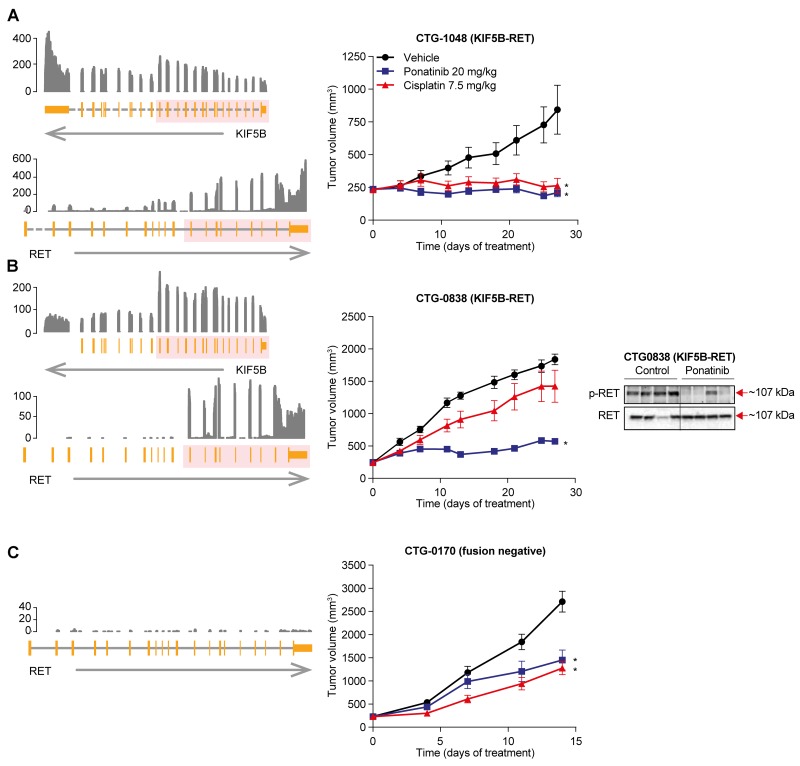
Figure 2. Anti-tumor activity of ponatinib in KIF5B-RET NSCLC PDX models.
Left panel, Schematic representation of the KIF5B-RET rearrangement in RET-fusion positive NSCLC tumor models CTG-1048 (A), CTG-0838 (B), and RET fusion negative CTG-0170 (C). From the bottom, an arrow shows the strand of each gene, with the gene structure drawn above. Dashed lines indicate introns not drawn to scale. The pink overlay shows the exons taking part in the fusion. Normalized RNA sequencing coverage is drawn above. Only RET exons included in the fusion are expressed. Middle panel, Mice bearing patient-derived NSCLC tumor models were evaluated for ponatinib or cisplatin sensitivity. Ponatinib (20 mg/kg q.d. orally) and cisplatin (7.5 mg/kg once-weekly i.p.) were administered for 28 days. Mean tumor volume and SEM are plotted. Each treatment group was compared with the vehicle group using 1-way ANOVA (*P < 0.05). Right Panel, Pharmacodynamic effect of ponatinib treatment in KIF5B-RET NSCLC PDX model CTG-0838, was assessed. Mice were administered a single oral dose of vehicle or ponatinib (20 mg/kg) and tumors were collected 6 hours later. Each lane represents a separate animal.

