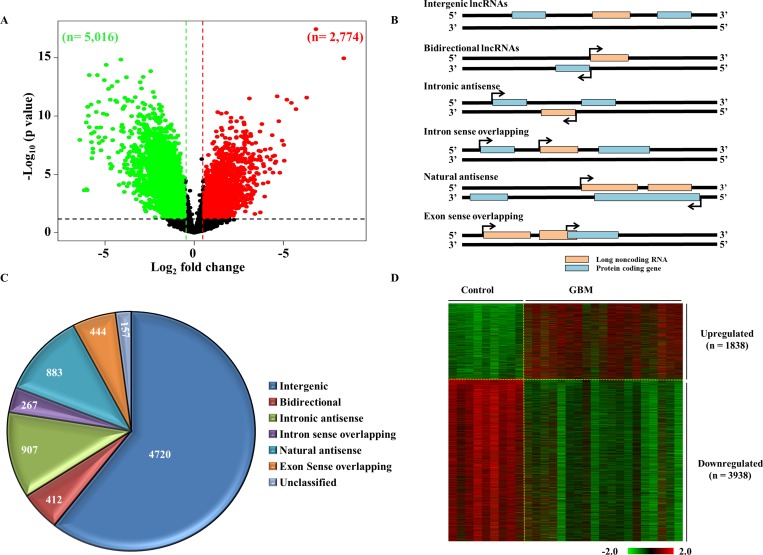
Figure 2. Differential regulation of lncRNAs in GBM.
(A) Volcano plot indicating the upregulated (red), downregulated (green) and unregulated (black) lncRNAs in GBM as compared to control brain. 7,790 lncRNAs were differentially regulated at a difference of ±1.5 fold on the log2 scale over the control (p < 0.05), which included 2,774 transcripts that were upregulated and 5,016 that were downregulated. (B) Schematic representation of the different types of lncRNAs. The lncRNAs (denoted as pink boxes) are classified into 6 groups based on their relative gene positions with respect to nearby mRNA genes (denoted in blue). (C) Representation of the classification of dysregulated lncRNAs as a pie chart. The numbers of lncRNAs corresponding to each class are indicated. (D) Heat map showing the normalised log2 values of the dysregulated lncRNAs genes in GBM over the control samples. Upregulated genes are denoted in red and downregulated genes are shown in green.

