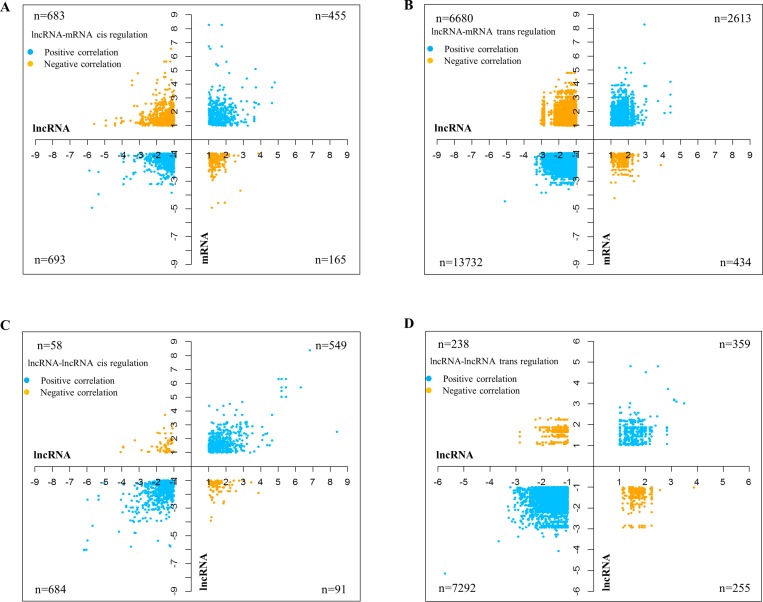
Figure 3. Correlation of lncRNAs with mRNAs and other lncRNA transcripts.
Graphs showing the correlations between lncRNAs and mRNAs in cis (A) and trans (B). Each dot represents a lncRNA-mRNA correlating pair. The positive correlations are shown in blue and the yellow dots represent the negative correlations. LncRNA-lncRNA correlations are similarly depicted, with correlations in cis in graph (C) and those in trans in graph (D). Due to the massive number of correlation pairs obtained for mRNAs in trans, only the pairs having correlation coefficients of 0.9 and above have been represented in (B) and (D). The number of pairs for each of the correlations carried out (n), are denoted in the graph.

