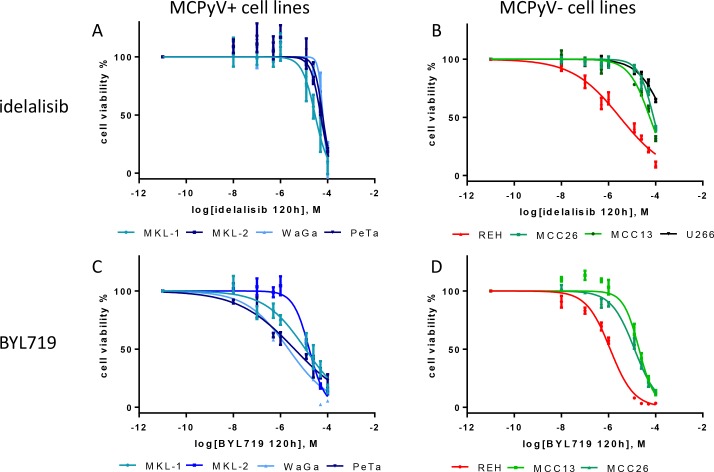
Figure 3.
Dose-response curves of the MCPyV-positive MKL-1, MKL-2, WaGa, PeTa (A and C), and MCPyV-negative MCC13, MCC26, REH and U266 (B and D) cell lines after 120 h treatment with varying molar concentrations [M] of idelalisib and BYL719. The cell viability is inhibited by idelalisib or BYL719 in all cell lines in a dose-dependent manner. IC50 were calculated from 3 independent (n = 3) experiments with eight replicates each. Bars symbolize the standard deviation of the mean. The overall p values of all dose response curves besided the treatment of U266 are < 0.001.

