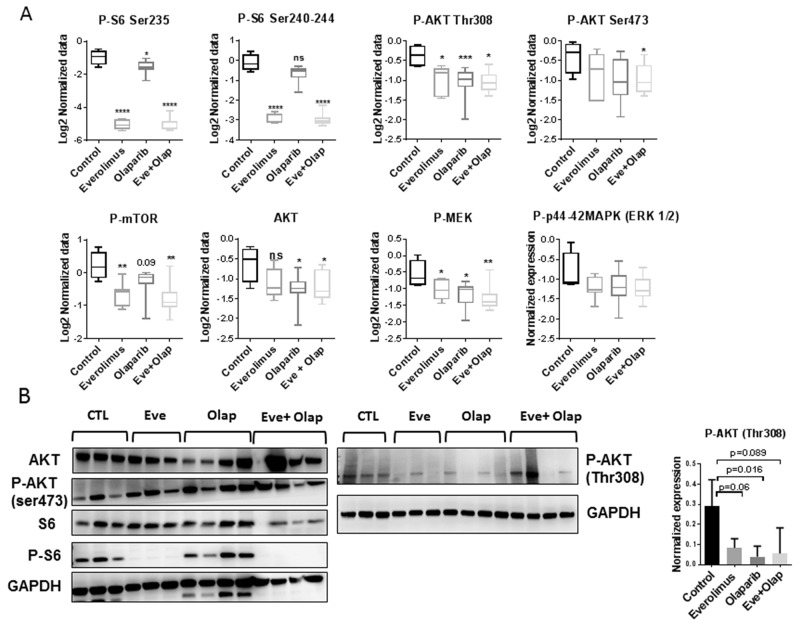
Figure 4. Analysis of PI3K/AKT/mTOR and MAPK pathways.
(A) RPPA analysis of selected proteins involved in PI3K/AKT/mTOR and MAPK pathways. Statistical analysis between groups was performed by the unpaired t-test.*p<0.05; **p<0.005; ***p< 0.0005. (B) Western blot validation of P-AKT and P-S6 inhibition in treated xenografts. N=3 or 4 xenografts/group. Normalized expression level of P-AKT (Thr308) determined by western blot analysis.

