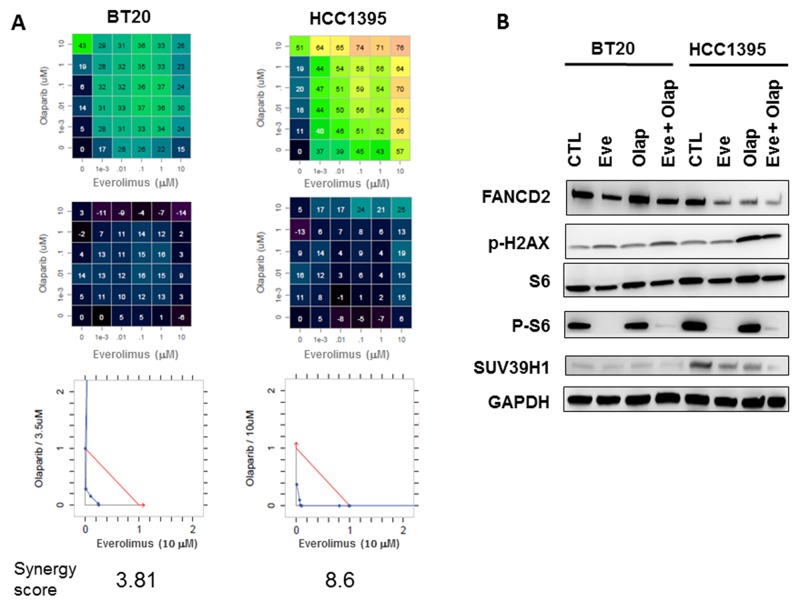
Figure 6. In vitro evaluation of everolimus and olaparib combinations in BT20 and HCC1395 breast cancer cell lines.
(A) Drug dose matrix data representing percentage of growth inhibitions (top panels), matrix with the loewe excess (middle panels) and isobolograms (bottom panels). (B) Western blot analysis of FANCD2, P-H2AX, S6/P-S6, SUV39H1 and GAPDH in BT20 and HCC1395 cell lines treated by everolimus and olaparib (10 μM).

