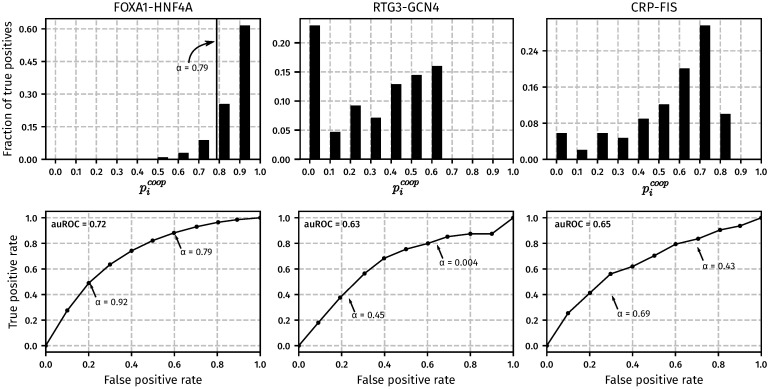
Fig 3. CPI-EM applied to ChIP-seq datasets from M. musculus (FOXA1-HNF4A), S. cerevisiae (RTG3-GCN4) and early-exponential phase cultures of E. coli(CRP-FIS).
For each dataset, CPI-EM computes a list of cooperative binding probabilities at all the locations bound by the TF pair under consideration. Top row: The fraction of cooperatively bound pairs, as determined from knockout data, that fall into each cooperative binding probability bin. The bins are equally spaced with a width of 0.1 and the heights of the bars within each histogram add up to 1. Bottom row: Receiver operating characteristic (ROC) curves that evaluate the performance of CPI-EM in detecting cooperatively bound pairs. The curve is generated by calculating, for each value of α between 0 and 1, the true and false positive rate of the algorithm. The true positive rate (TPR(α)) is the ratio of the number of cooperatively bound regions detected (when pcoop is compared to a threshold of α) to the total number of regions that are found to be cooperatively bound from the knockout data. The false positive rate (FPR(α)) is the ratio of the number of non-cooperatively bound regions mistakenly detected as cooperatively bound (when pcoop is compared to a threshold of α), to the total number of regions that are found to be non-cooperatively bound from the knockout data. Small values of α give a higher TPR, but at the cost of a higher FPR. The area under the ROC (auROC) is a measure of detection performance, whose value cannot exceed 1, which corresponds to a perfect detector. Given the auROC of two different algorithms, the one with a higher auROC is better, on average, at detecting cooperative binding.

