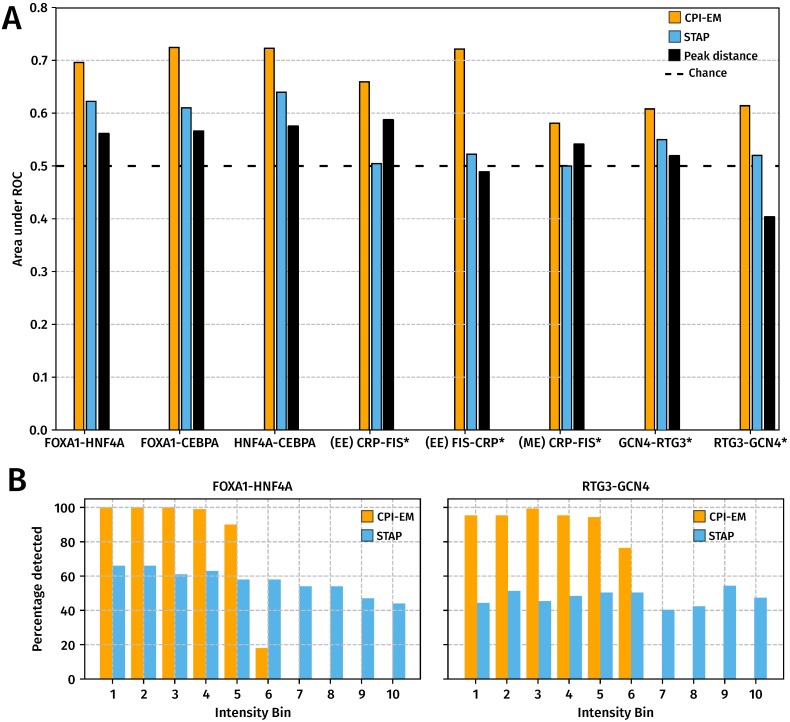
Fig 4. CPI-EM outperforms STAP and the peak distance detector in detecting cooperatively bound TF pairs across different datasets, even though STAP can better detect cooperatively bound target TF peaks that have high intensities.
(A) The auROCs of CPI-EM and STAP are shown in orange and sky blue, respectively. The auROC of the chance detector, which is always 0.5 is shown by a dashed line. The datasets marked with an asterisk (*) are those where STAP was numerically unstable (see Materials and methods). The complete ROC curves for STAP and CPI-EM are shown in Fig M in S1 Appendix and that of the peak distance detector in Fig P in S1 Appendix. (B) CPI-EM detects more cooperative interactions amongst low intensity target TF peaks but STAP detects more such interactions amongst higher intensity target TF peaks. On the x–axis, cooperatively bound FOXA1-HNF4A and RTG3-GCN4 peak pairs are divided into ten bins based on the intensity of the target TF, with the 10th bin having the highest intensity target TF peaks. The y–axis represents the percentage of cooperative peak pairs actually detected by CPI-EM (orange) or STAP (sky blue) in each bin at a false positive rate of 40%.

