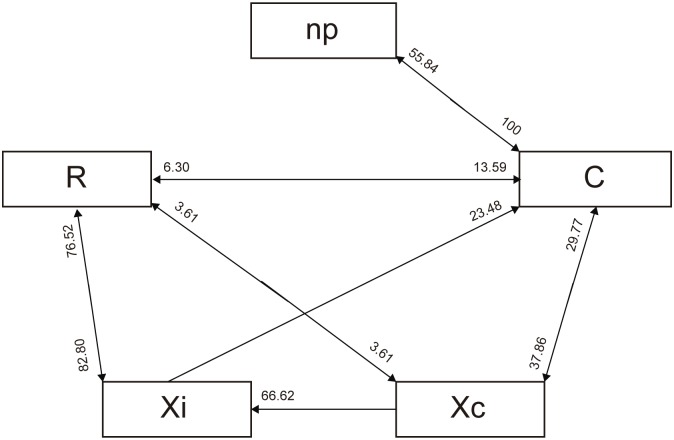
Fig 4. Transition scheme of waveforms events for P. spumarius on olive cv Picual during the 8 hours EPG (likelihood of waveforms events).
The values near the arrows correspond to the likelihood of a certain waveform being followed by another waveform type. Probabilities <2% are not shown. Waveform N was not represented in the diagram, because it occurs as brief interruption within waveforms Xc and Xi (and likely R).

