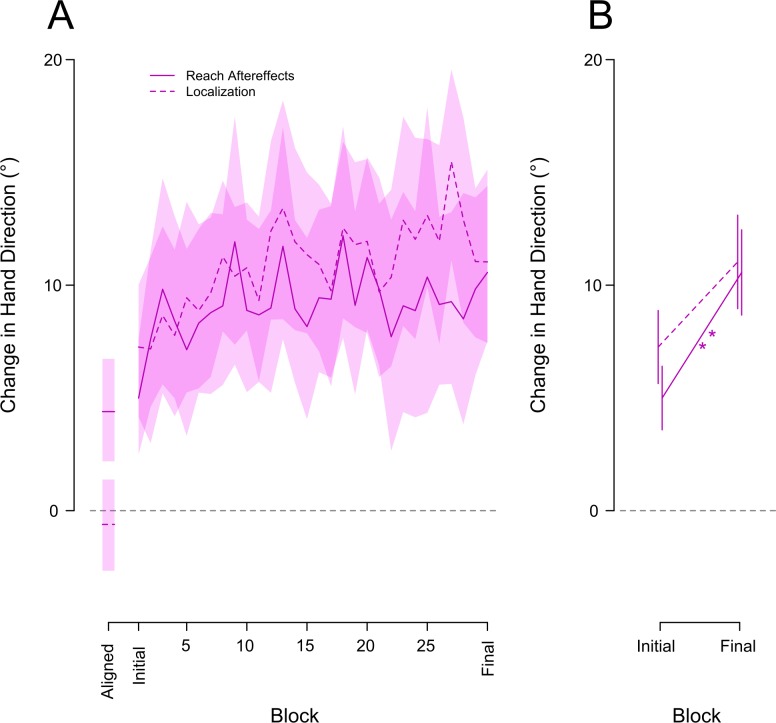
Fig 3.
Reach aftereffects (solid lines) and proprioceptive localizations (dashed lines) plotted as a function of all blocks (A) and for the first and last block (B) during the rotated condition. No-cursor reaches and proprioceptive localization for the final block of the aligned condition are also shown in at the far left of panel A, the rotated condition results have these baseline data subtracted out to normalize the results. The shaded areas for the curves in A represent a 95% confidence interval. The asterisk in B indicates significant differences between blocks; one star is significant to .01, two stars are significant to .001. Error bars are +/- 1 standard error.

