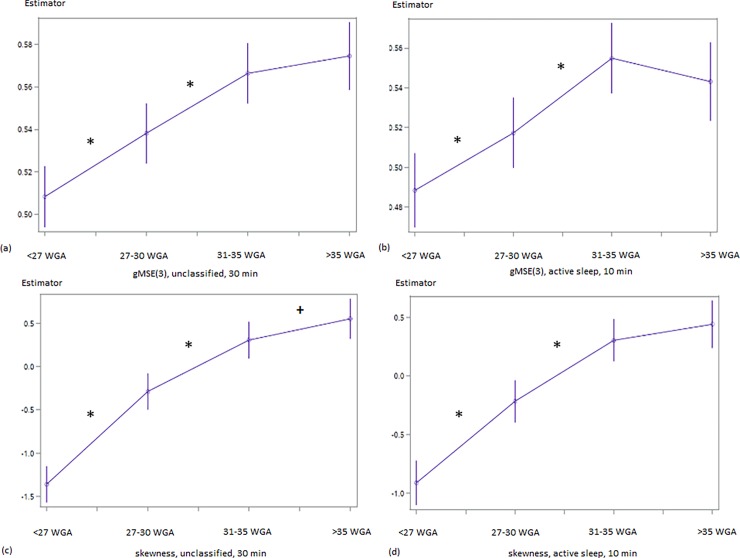
Fig 2.
Developmental course of gMSE(3) (a, b) and skewness (c, d) in the linear mixed model. (a) unclassified datasets: SoI {1–2} χ2 = 11,81; p<0.001, SoI {2–3} χ2 = 10.04; p = 0.0013; (b) fetal active sleep SoI {1–2} χ2 = 6.7, p = 0.0096, SoI {2–3} χ2 = 12.17, p<0.001; (c) unclassified datasets: SoI {1–2} χ2 = 70.31, p<0.0001, SoI {2–3} χ2 = 21.29, p<0.001, SoI {3–4} χ2 = 3.16, p = 0.076; (d) fetal active sleep: SoI {1–2} χ2 = 35.50, p<0.0001, SoI {2–3} χ2 = 21.13, p<0.0001. x–Segment of Interest {< 27 WGA; 27–30 WGA; 31–35 WGA;>35 WGA}; completed weeks of GA; y–Estimator in [bitnorm] Significant (p<0.05) contrasts are marked by *, trends (p<0.10) by +. Results for ‘fetal quiescence’ are not shown because they did not reach significant levels (gMSE(3): SoI {2–3}, χ2 = 3.41; p = 0.07).

