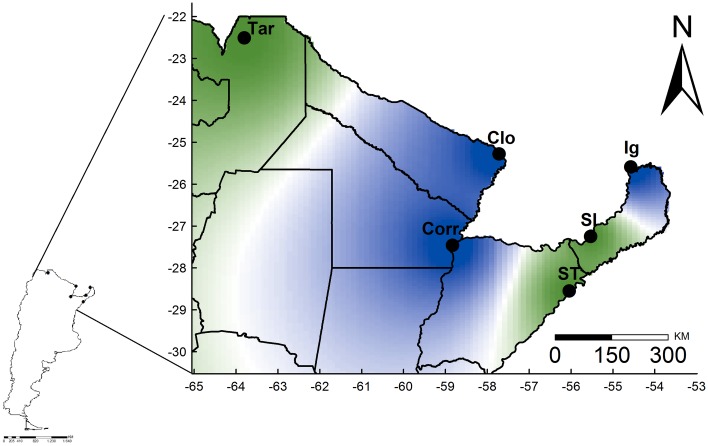
Fig 2. Spatial distribution of Argentinian Lutzomyia longipalpis genetic clusters inferred with Geneland.
The highest membership values are in green (cluster 1) and blue (cluster 2) to a low PP (light green and light blue to white). Cluster 1: Tartagal (Tar), Santo Tomé (ST), and San Ignacio (SI); Cluster 2: Corrientes city (Corr), Clorinda (Clo) and Puerto Iguazú (Ig). This map was generated using QGIS v.2.6.1 [61].

