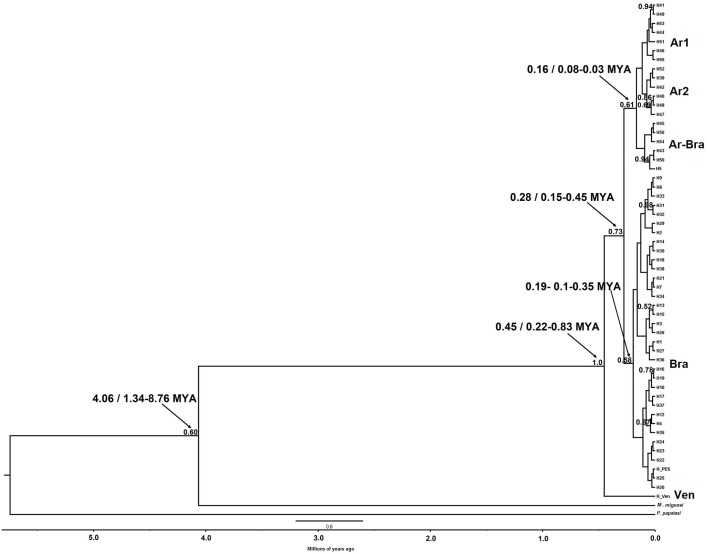
Fig 6. Calibrated maximum-clade-credibility tree for the Lu. longipalpis complex using the 3´ region of the cyt b gene.
The HKY + G model was used for a 261 base pair dataset. Numbers above each branch represent PP from the BI (≥ 0.95). M. migonei and P. papatasi were used as outgroup. The scale bar represents the line of time in million years ago (MYA) and the numbers indicated by arrows show the time estimate and the 95% HPD.

